Excel Imaging: Practical Techniques for Pictures in Spreadsheets
Learn practical techniques to insert, manage, and optimize images in Excel. This XLS Library guide covers formats, sizing, compression, and image-based dashboards for professional data storytelling.

In this guide you will learn how to insert, size, compress, and use images in Excel to enhance dashboards and reports. You’ll cover image formats, the Camera tool, linked pictures, accessibility with alt text, and practical tips to keep workbooks responsive. By the end, you’ll be able to integrate images confidently.
Understanding Image Fundamentals in Excel
Images in Excel are not just decoration — when used thoughtfully they support data storytelling, branding, and context. In this section, we cover the basics of image formats, resolution, and how Excel handles embedded media. For practical dashboards, choose formats that balance quality and file size: PNG for graphics and logos with transparency, JPEG for photographs, and GIF for simple animations (where supported). Important: while Excel can embed media, large images can bloat workbooks, so plan usage accordingly.
According to XLS Library, imaging in Excel is a practical skill that enhances dashboards and reports. The right image choices help readers interpret data faster and maintain a professional look across devices. The goal is to use visuals to clarify, not overwhelm; consistency in style and size matters across sheets. By understanding image fundamentals, you’ll avoid common pitfalls such as distortion, misalignment, and broken links when sharing workbooks.
Inserting and Managing Images in Your Workbook
Begin by selecting the worksheet that will host the image. Go to Insert > Pictures and choose From This Device (or Online Pictures depending on your version). Navigate to your image, select it, and confirm. Once placed, use the handles to resize while holding Shift to preserve aspect ratio. Align the image with cell borders or headers to keep the design tidy. In spreadsheets with many images, consider grouping related visuals and using alternating sheet backgrounds to reduce cognitive load.
To improve accessibility, add alt text by right-clicking the image and choosing Edit Alt Text. Alt text describes the image for assistive technologies and helps search engines understand context. If you plan to reuse images in multiple sheets, you can duplicate the image instead of re-inserting to save time. For large dashboards, limit the number of images per sheet and consider linking images where appropriate to reduce duplication. In practice, consistent margins, padding, and clear captions elevate a dashboard from good to great.
Optimizing Images for Performance
Images can significantly affect workbook performance and file size. Start by compressing pictures: select an image, go to Picture Tools > Format > Compress Pictures, and choose options that balance quality and size. If you expect to share the workbook widely, compressing all images before saving is a prudent step. Consider whether you need to embed or link each image: linked pictures keep file size small but depend on the external image path; embedded images ensure portability but increase size.
XLS Library analysis shows that disciplined image management can improve workbook performance, especially in dashboards with multiple visuals. A practical approach is to store source images in a centralized folder and link to them when updates are frequent; then, when finalizing the workbook, replace links with embedded images only for critical visuals. Remember to save copies in a stable location and test opening the file on another computer to ensure links survive.
Using Images in Data Visualization and Dashboards
Images are most powerful when aligned with your data narrative. Use logos, product photos, or category illustrations to anchor sections of a dashboard. Place images near relevant charts or tables to create visual anchors. For dynamic visuals, consider using the Camera tool to capture a live snapshot of a data range and place it elsewhere on the dashboard. This technique creates a sense of a living report while keeping formulas intact in the source area.
With careful placement, images can guide user attention and improve readability. If you include images in a grid of metrics, ensure consistent aspect ratios and margins to avoid a cluttered look. For color consistency, reuse a restrained color palette across images and charts. When you publish or share, verify that all embedded images render correctly on different devices and Excel versions.
Practical Techniques: Camera Tool, Linked Pictures, and Image Notes
The Camera tool is a powerful but underutilized feature. To use it, add the Camera command to your Quick Access Toolbar, select the range you want to snapshot, and press the Camera button. Paste the snapshot in the target area; it remains linked to the source range so updates reflect automatically. Use Paste Special > Linked Picture when you want changes to propagate.
Linked pictures are useful to keep a single source of truth while displaying data wherever needed. They are especially handy in dashboards where you repeat charts across sheets. Add descriptive captions and Alt Text to every image, and group related visuals to reduce cognitive load. If a visual seems out of place, adjust the grid alignment and ensure it scales with the rest of the layout as you resize columns and rows.
Accessibility, Compliance, and Best Practices
Accessibility requires alt text for all images and meaningful captions for charts. Provide concise descriptions that convey the image’s purpose in the context of the data. Compliance considerations include avoiding sensitive imagery in publicly shared dashboards and ensuring images do not misrepresent data. Consistency matters: use a single visual style, consistent margins, and uniform sizes for a polished look. Finally, test your workbook across devices and Excel versions to catch any rendering differences.
Tools & Materials
- Computer with Excel installed (Office 365 or 2019+)(Ensure you have access to Picture Tools and the Camera feature)
- Images in JPEG or PNG format(Prefer PNG for graphics with transparency; JPEG for photos)
- Backup copy of workbook(Create a revision-safe copy before heavy image edits)
- Centralized image folder (optional)(Helpful when using linked images for dashboards)
- Camera Tool (added to Quick Access Toolbar)(Enable via Customize Quick Access Toolbar)
Steps
Estimated time: 45-60 minutes
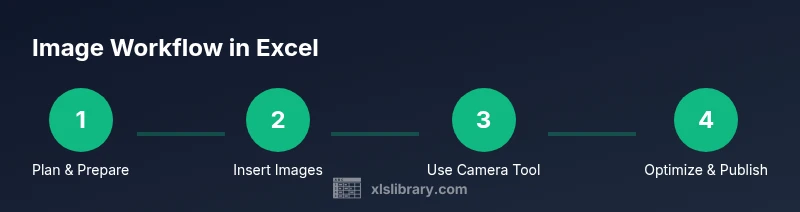
- 1
Prepare images and dashboard plan
Collect all images you plan to use and outline the dashboard sections where visuals will appear. Decide which images should be borders/headers, logos, or data illustrations. This upfront planning reduces churn later and keeps visuals cohesive.
Tip: Organize assets in a clearly named folder and keep a simple style guide for image dimensions. - 2
Insert images into the workbook
On the target worksheet, choose Insert > Pictures and select From This Device. Pick your file and place it where it supports the intended narrative. Maintain alignment with surrounding data for a clean layout.
Tip: Hold Shift while resizing to preserve the aspect ratio and avoid distortion. - 3
Preserve aspect ratio and alignment
After placing an image, use the corner handles to resize. Snap images to gridlines or object anchors to create a tidy dashboard. Consistent margins reduce visual clutter.
Tip: Use the Align tools in Picture Tools > Format to establish uniform spacing. - 4
Enable and use the Camera tool
If your workbook requires dynamic visuals, enable the Camera tool, select a data range, and insert a snapshot elsewhere. The snapshot updates when the source data changes, keeping dashboards current without duplicating formulas.
Tip: Add the Camera command to the Quick Access Toolbar for faster use. - 5
Decide on embedding vs linking
Linking images keeps file size small but depends on external image paths. Embedding images ensures the workbook travels well, but increases size.
Tip: For ongoing projects, start with links; switch to embedding for final delivery. - 6
Add captions and alt text
Right-click images to add alt text and captions. Alt text supports accessibility and searchability, while captions provide context for readers.
Tip: Keep alt text concise and descriptive, tied to the image’s data role.
People Also Ask
Can I insert images in Excel from online sources?
Yes. In many Excel versions you can insert pictures from online sources or stock repositories, but ensure compliance with licensing and consider linking to external sources when updating is frequent.
You can insert from online sources in many versions, but check licensing and consider links for updates.
How do I reduce file size when images are included?
Compress pictures via Picture Tools > Format > Compress Pictures. Choose a setting that balances quality with file size and consider linking images when possible.
Compress pictures and consider linking images to save space.
What is the Camera tool and when should I use it?
The Camera tool creates a live snapshot of a cell range that stays updated with source data. Use it for dynamic dashboards where the visualization needs to reflect changing numbers.
The Camera tool snapshots a data range that updates with the source data.
Should I embed images or link to them?
Embed images for portability, especially when sharing files. Link images to reduce size, but ensure the path remains valid when others open the workbook.
Embed for portability, link to reduce size, and manage paths carefully.
How do I add alt text to images?
Right-click the image, choose Edit Alt Text, and provide a concise, descriptive description that ties to the data context.
Edit Alt Text to describe the image for accessibility.
Watch Video
The Essentials
- Plan image usage before inserting assets.
- Use PNG for graphics and JPEG for photos to balance quality and size.
- Leverage the Camera tool for dynamic dashboards.
- Prefer alt text and captions for accessibility and clarity.