Is Excel Similar to Power BI? Practical Comparison
Explore how Excel and Power BI differ and overlap, with practical guidance on data modeling, dashboards, and hybrid workflows for analysts of all levels.

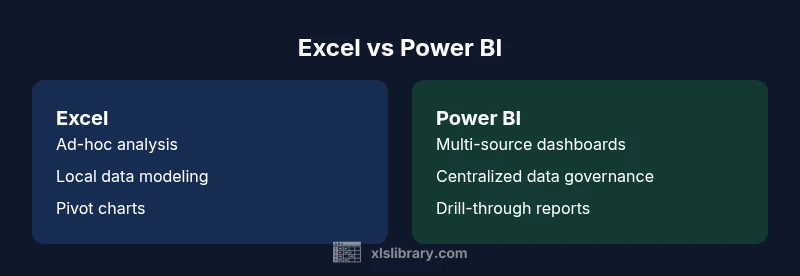
Excel and Power BI are related tools but serve different needs: Excel handles flexible data entry and ad-hoc analysis, while Power BI builds scalable dashboards from multiple sources. This quick comparison highlights where they overlap and where they diverge, helping you choose the right tool for each task. For analysts, the best approach is often a hybrid workflow—prepare in Excel, visualize and govern in Power BI.
Is Excel Similar to Power BI? A Practical Intro
Is Excel similar to Power BI? This question comes up frequently among analysts and teams migrating from spreadsheet-centric workflows to BI platforms. According to XLS Library, Excel remains a foundational tool for data prep and quick modeling, while Power BI addresses governance and scalable analytics. In practice, most organizations use both: Excel for data wrangling and what-if analysis, and Power BI for centralized dashboards and reporting across departments. Understanding where each tool shines helps you design a hybrid workflow that minimizes friction and maximizes insight. Throughout this article, the key idea is to map tasks to capabilities: data preparation and rapid exploration belong in Excel; scalable analytics and governance belong in Power BI. Expect practical criteria, tangible examples, and step-by-step guidelines you can apply in real projects.
Core Differences in Scope and Scale
The most visible divergence between Excel and Power BI is scope. Excel anchors individual workbooks with flexible formulas, pivot tables, and local data modeling, enabling rapid exploration without needing a server or a cloud environment. Power BI, by contrast, is built to serve organizations: it centralizes data into datasets, enforces governance rules, and delivers dashboards that multiple users can view and interact with. When you scale, Excel depends on hardware and workbook design, while Power BI leverages a managed service, in-memory analytics, and incremental refresh to handle large datasets efficiently. The practical implication: start small in Excel for quick wins, then move to Power BI for enterprise-wide analytics and distribution. A blended workflow often produces the best balance between speed and governance.
Data Modeling: Tables, Relationships, and Measures
Data modeling lays the groundwork for reliable analysis. In Excel, you can build a data model using the built-in Data Model feature (Power Pivot) to relate tables and create measures with DAX, but the modeling environment is still workbook-centric. Power BI offers a more mature data modeling experience: you can define relationships across many tables, write advanced measures with DAX, enforce row-level security, and layer in calculated tables. For analysts who work with multiple data sources, Power BI’s model is designed to be portable and reusable across reports, which reduces duplication and keeps business logic centralized. The takeaway is to reserve Power BI for complex models that require governance and reuse, while using Excel for quick, exploratory models that don’t require enterprise-scale security.
Data Sources and Connectivity
Excel connects to a wide range of data sources, from local files to external databases via Power Query. However, Excel connections are often tied to the workbook, which can complicate sharing and refreshing in a team setting. Power BI emphasizes broad connectivity: it can pull from cloud-based data sources, SaaS apps, databases, and even Excel workbooks hosted in the cloud, then refresh datasets on a schedule. This makes Power BI ideal for ongoing reporting and dashboards that must reflect up-to-date information from disparate systems. The practical pattern is to pull data into a centralized Power BI dataset when possible, while keeping raw data and initial cleansing steps in Excel when the data wrangling is highly interactive and experimental.
Transformation and Cleaning: Power Query vs Excel Tools
Power Query is a powerful ETL (extract, transform, load) tool embedded in Power BI and accessible from Excel. It enables repeatable, auditable transformations across large data volumes, including joins, merges, pivoting, and advanced filtering. Excel’s data-cleaning capabilities are strong but more manual in nature, relying on formulas, Power Query add-ins, and data connection queries. In practical terms, Power Query in Power BI offers a more scalable, repeatable pipeline for data cleaning and transformation, while Excel allows for rapid, hands-on cleaning when you’re exploring hypotheses. A best-practice pattern is to use Power Query for the core ETL process and reserve Excel for quick adjustments or ad-hoc refinements.
Visualization and Dashboards: Interactivity and Accessibility
Excel provides a rich set of charts, conditional formatting, and basic pivot-driven visuals suitable for one-off analyses and light dashboards. Power BI specializes in polished, interactive dashboards with drill-through, slicers, and advanced visuals that scale to large audiences. Dashboards in Power BI can be centralized, shared securely, and embedded in apps or websites, making them accessible beyond a single user. In contrast, Excel dashboards are often distributed as workbooks or shared via OneDrive and require careful version control. The practical takeaway is to use Excel for local, flexible visualization during analysis, and Power BI for distributed, interactive dashboards that support decision-making at scale.
Collaboration, Governance, and Security
Collaboration is straightforward in Excel when working in shared workbooks or folders, but it can become chaotic without governance. Power BI introduces structured collaboration: datasets, reports, dashboards, and apps can be published to the Power BI service with role-based access, data lineage, and audit trails. Row-level security and centralized governance models help ensure that stakeholders see the right data. For teams, this means a more governed analytics environment in Power BI, paired with the flexibility of Excel for raw data work and local experimentation. The practical pattern is to create a governed BI layer in Power BI while enabling analysts to contribute raw data and exploratory analyses in Excel when appropriate.
Performance and Scalability Over Time
Performance in Excel hinges on workbook size, hardware, and efficient worksheet design. Large, complex models can become unwieldy, slow, and error-prone without careful optimization. Power BI, with its in-memory engine and optimized data model, typically handles larger datasets and supports scheduled refreshes, incremental loading, and caching. This makes Power BI a more scalable choice for ongoing analytics across departments. The caveat is that BI governance, data modeling discipline, and thoughtful dataset design are prerequisites for achieving consistent performance at scale.
Pricing, Licensing, and Ecosystem Integration
Pricing and licensing differ meaningfully between the two tools. Excel is often bundled with Office subscriptions and, in many cases, included as part of broader productivity suites. Power BI has its own licensing model, including per-user and capacity-based options, and it integrates tightly with other Microsoft tools and the broader Power Platform. Consider total cost of ownership, including training, governance, and maintenance, when comparing tools. This analysis helps teams decide whether an Excel-centered workflow suffices or whether investment in Power BI licensing provides better long-term value for dashboards and enterprise reporting.
Use-Case Scenarios: When to Use Excel vs Power BI
Scenario-based guidance helps teams map tasks to capabilities. Use Excel for quick data entry, exploratory analysis, what-if scenarios, and model prototyping. Turn to Power BI when you need centralized dashboards, multi-source data integration, governance, and scalable distribution. Real-world workflows often blend both: analysts prepare and validate data in Excel, then publish to Power BI for organization-wide reporting and dashboards. The key is to keep data models clean, ensure refresh pipelines are robust, and establish governance rules for shared datasets.
Hybrid Approaches: When to Combine Excel and Power BI
Many organizations optimize the value of both tools with deliberate hybrid workflows. Start by identifying the data sources and the analytical tasks best suited to each tool. Create a shared data model in Power BI that pulls from cleansed Excel sources or from centralized databases. Use Excel for local experimentation and rapid scenario testing, then port validated results into Power BI for distribution. Establish a data refresh plan, version control, and a governance framework so both tools stay synchronized. Finally, invest in cross-training to enable team members to move fluidly between Excel and Power BI as project needs evolve.
Comparison
| Feature | Excel | Power BI |
|---|---|---|
| Data Modeling Capability | Basic data modeling with tables and the Data Model (Power Pivot) in Excel | Advanced data modeling with relationships, measures, DAX, and data lineage in Power BI |
| Data Volume/Performance | Moderate workbook-level performance; depends on hardware | Optimized for large datasets with in-memory engine and incremental refresh |
| Data Connectivity | Local files; Office-integrated connections | Broad connectivity to cloud sources, databases, APIs, and files |
| Visualization & Dashboards | Pivot charts and standard charts; interactive but workbook-centered | Rich, interactive dashboards with drill-through, filters, and visuals |
| Sharing & Collaboration | Workbook-based sharing; version control can be challenging | Centralized dashboards/reports with controlled access via Power BI Service |
| Governance & Security | Basic protection; governance relies on user discipline | Enterprise-grade governance, row-level security, audit logs |
| Pricing & Licensing | Often included with Office subscriptions (varies by plan) | Separate license per user or capacity; pricing tiers exist |
| Best For | Ad-hoc analysis, rapid modeling, small-scale projects | Enterprise dashboards, multi-source reporting, governance |
Benefits
- Flexible data modeling and ad-hoc analysis in a familiar environment
- Low upfront cost for individuals and small teams
- Extensive function library and add-ins for data cleaning and calculation
- Broad ecosystem with strong integration to other Microsoft tools
What's Bad
- Limited enterprise governance and data lineage in pure Excel
- Excel workbooks can become hard to manage at scale without governance
- Excel dashboards lack centralized sharing and distribution features
- Power BI requires licensing considerations and a learning curve for new users
Hybrid approach wins: use Excel for data prep and rapid modeling, then publish to Power BI for scalable dashboards and governance
Excel handles flexibility and rapid experimentation well, while Power BI provides scalable dashboards and centralized governance. By combining both tools, teams can move from raw data to repeatable, governed analytics without sacrificing agility.
People Also Ask
Is Excel similar to Power BI?
They share some capabilities, but they target different workflows. Excel is best for flexible data entry and ad-hoc analysis; Power BI is built for scalable dashboards and centralized reporting.
Excel is great for quick analysis; Power BI shines with scalable dashboards for teams.
Can Excel replace Power BI for dashboards?
Not typically for enterprise dashboards; Excel can create simple dashboards, but it lacks governance, distribution, and multi-source data handling that Power BI provides.
You can make dashboards in Excel, but for scalable, governed dashboards, Power BI is preferred.
Is Power BI necessary for data visualization?
No, Excel can visualize data with charts and dashboards, but Power BI offers stronger interactivity, collaboration, and enterprise-ready visuals.
Excel can visualize data, but BI tools shine in multi-user dashboards.
How do I connect Excel data to Power BI?
Power BI can import data from Excel files and connect to Excel data models; you can publish Excel-based reports to the Power BI service for broader access.
Yes, you can connect Excel workbooks to Power BI easily.
Can I use both in a workflow?
Yes; wrangle data in Excel and publish to Power BI for dashboards. Ensure refresh pipelines and data models stay synchronized.
Absolutely, a hybrid approach is common.
What licensing considerations exist?
Excel licensing typically comes with Office subscriptions; Power BI has separate per-user or capacity licenses. Plan based on team size and sharing needs.
Licensing varies; plan according to scale and governance needs.
The Essentials
- Define analytics goals before tool selection
- Excel excels at data prep and ad-hoc analysis
- Power BI scales dashboards and governance for teams
- Use a hybrid workflow to maximize strengths of both tools
- Invest in cross-training to enable seamless collaboration