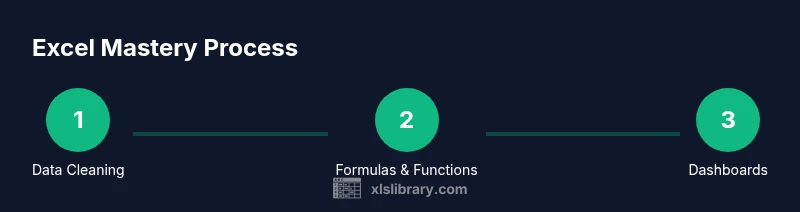
Excel and Advanced Excel: A Practical Mastery Guide
Master practical Excel and advanced Excel techniques—from data cleaning to powerful formulas and dashboards—with a practical, step-by-step guide by XLS Library.

You will learn how to master Excel and advanced Excel techniques, from cleaning data and building robust formulas to crafting dashboards and automating tasks. This guide lays out a clear, step-by-step path: start with essential data handling, move through core functions, then tackle complex analyses and visual storytelling with charts and dashboards.
Why Excel and Advanced Excel Matter
In today’s data-driven workplaces, the ability to transform raw numbers into actionable insights starts with solid Excel and Advanced Excel skills. The XLS Library team notes that professionals who invest in both foundational and advanced techniques tend to work more efficiently and produce reproducible results. Mastery isn’t just about memorizing functions; it’s about understanding data structures, identifying when to clean data, and knowing which tools to apply to specific tasks.
This section clarifies why combining basic Excel capabilities with advanced features offers a scalable path from entry-level analysis to strategic reporting. You’ll see how disciplined data organization, robust formulas, and thoughtful visualization turn scattered data into credible stories. The approach described here is deliberately practical: learn by doing with real datasets, build reusable templates, and gradually layer automation that saves you time on recurring tasks. By the end, you’ll be able to tackle typical business scenarios—budget tracking, KPI dashboards, ad-hoc analyses—with confidence. According to XLS Library guidance, the most successful practitioners treat Excel and Advanced Excel as a single continuum rather than two separate skill sets.
Data Cleaning and Preparation: Laying a Solid Foundation for Excel and Advanced Excel
Effective analysis begins with clean data. In this section you’ll learn practical strategies to identify and fix common data quality issues, such as duplicates, inconsistent formatting, and missing values. You’ll see concrete steps for standardizing data types, splitting or merging columns, and creating a dependable data source that feeds every formula, pivot, or dashboard you build. The goal is to minimize downstream errors and maximize reproducibility. The guidance from XLS Library emphasizes building repeatable cleaning processes, so your workflows scale as datasets grow.
Key techniques include using text-to-columns, trimming spaces, and converting data types with DATE, TIME, and VALUE functions. You’ll practice with a sample workbook and develop a checklist you can reuse on every project. A clean dataset improves the reliability of even the most complex Excel and Advanced Excel analyses and makes automation far more effective.
Core Formulas You Must Master: Lookup, Logic, and Math
Core formulas are the backbone of Excel and Advanced Excel proficiency. Start with SUM, AVERAGE, COUNT, and then move to conditional logic with IF, AND, OR. VLOOKUP has long been a staple, but XLOOKUP and INDEX/MATCH offer greater flexibility and reliability across datasets. You’ll also explore SUMIFS, COUNTIFS, and AVERAGEIFS to perform multi-criteria analysis. This section includes practical examples—how to join datasets, perform lookups across multiple sheets, and handle missing results gracefully. You’ll learn to build transparent, auditable formulas that teammates can review and reuse.
Practice scenarios include matching orders to customers, calculating gross margins, and verifying data integrity across dimensions. The aim is to build a core toolkit that remains relevant as you advance into dynamic arrays, Power Query, and automation.
Pro tip: when constructing formulas, break complex problems into smaller parts and verify each component separately to avoid cascading errors.
Dynamic Arrays and Advanced Functions: Elevating Your Calculations
Dynamic arrays change how you write and understand formulas. Functions like FILTER, SORT, UNIQUE, SEQUENCE, and RANDARRAY enable compact solutions that previously required lengthy constructions. This section demonstrates how to replace repetitive, nested formulas with concise expressions that adapt to changing data. You’ll learn to build spill ranges, manage errors with IFERROR, and create compact data pipelines that feed dashboards and reports. Real-world examples show how dynamic arrays simplify tasks such as de-duplicating lists, extracting unique categories, and filtering data based on multiple criteria.
Along the way, you’ll see best practices for error handling, documentation, and maintaining readability when sharing sheets with colleagues. The goal is to reduce maintenance time while increasing the robustness of your analyses.
Tip: name your spill-producing formulas and reference them in named ranges to improve clarity and reuse.
Power Query and Data Connectivity: Automating Prep and Integration
Power Query is a transformative tool for data ingestion, shaping, and cleaning. In this section you’ll learn how to connect to a variety of data sources (CSV, JSON, databases, web data), apply transformations, and load the results into Excel for analysis. You’ll practice common tasks such as removing columns, splitting data, pivoting/unpivoting, and performing merges. The ability to automate data refreshes reduces manual steps and ensures your dashboards stay up to date.
We’ll cover best practices for query folding, parameterization, and error handling so that your data connections remain reliable across sessions and workbook versions. The result is a repeatable, auditable data pipeline that powers analytics without repeated manual cleanup.
Note: Power Query works particularly well with Excel for Windows; Mac users may have some feature limitations depending on the version and build.
Building Models: Data Validation, Named Ranges, and Structured References
A robust data model makes analysis scalable and transparent. This section covers best practices for organizing workbooks into logical models, using named ranges for clarity, and implementing data validation to catch entry mistakes at the source. You’ll learn to design structured references in tables and how to maintain clean data models as datasets evolve. We’ll also discuss separating data, calculations, and presentation layers to reduce errors and improve collaboration.
Practical guidance includes creating a master data sheet, deriving parameter tables, and linking to calculations using named ranges. The emphasis is on building models that are easy to audit, update, and reuse across projects.
Pro tip: keep data and calculations in separate sheets and document assumptions in a dedicated “Notes” sheet to foster long-term maintainability.
Visualization and Dashboards: Turning Data Into Stories
A dashboard is more than pretty charts; it’s a narrative that highlights drivers, trends, and risks. In this section you’ll learn how to design dashboards that support decision-making. We cover chart selection, layout best practices, and interactive features like slicers and dynamic titles. You’ll practice mapping data to visuals, aligning scales, and avoiding chart clutter that obscures insights.
The content focuses on practical approaches to data storytelling: define audience and questions, choose the right visuals, and link visuals to the underlying data model. You’ll also learn how to validate dashboards with stakeholders and iterate based on feedback.
In real-world workflows, dashboards built with Excel and Advanced Excel techniques can become essential decision-support tools for teams.
Automation Basics: Macros, VBA, and Practical Automation Workflows
Automation can save hours of repetitive work. This section introduces macros and the simple VBA concepts that unlock routine automation. You’ll learn when to automate, how to record macros for repeatable tasks, and how to edit macro code to tailor it to your workflow. We’ll also discuss safer macro practices, such as using signed macros, limiting macro scope, and testing changes in a copy of the workbook to avoid disrupting live data.
Beyond VBA, you’ll see Office Scripts concepts as a modern automation path for cross-platform scenarios. The goal is to help you implement reliable automations that scale as your data processes evolve.
Pro tip: start with a single repetitive task, automate it, and validate thoroughly before expanding automation across the workbook.
From Raw Data to Insights: A Practical Workflow and Case Study
This final content block ties everything together with a practical dataset and a step-by-step case study. You’ll see how to approach a real-world problem from data cleaning through to insights and recommendations. The workflow includes activities such as preparing data, applying formulas, creating visuals, and validating with stakeholders. By following the steps, you’ll transform messy inputs into clear, actionable outcomes using Excel and Advanced Excel techniques.
XLS Library’s approach emphasizes repeatability and documentation, so your case study can be reused or adapted for future projects. The case study also demonstrates how to communicate findings effectively to business partners, ensuring insights translate into action.
Verdict and next steps: continue practicing with increasingly complex datasets, progressively add automation, and build a personal library of templates that you can deploy across projects.
Tools & Materials
- Licensed Excel software (Excel 365/2026)(Ensure latest update for dynamic arrays and Power Query features.)
- Computer or laptop with internet(Minimum 8 GB RAM, 2 cores; prefer SSD for faster data handling.)
- Sample data workbook(Use a clean dataset that includes duplicates, missing values, and multiple sheets.)
- External reference cheat sheet(Optional quick lookup for formulas and functions.)
- Notepad or digital notes app(For documenting decisions and formulas.)
Steps
Estimated time: 4-6 hours
- 1
Define learning goals
Outline what you want to achieve with Excel and Advanced Excel, including data cleaning, core formulas, dashboards, and automation. Set measurable targets and create a rough plan for practice datasets.
Tip: Write down 3 concrete outcomes you want to be able to deliver by the end of the course. - 2
Prepare a clean dataset
Open a representative dataset and identify quality issues: duplicates, inconsistent formats, and missing values. Create a clean copy for your practice work and establish a reproducible cleaning routine.
Tip: Document any data-cleaning decisions in a separate sheet or notes file. - 3
Master core formulas
Focus on SUM, AVERAGE, COUNT, IF, XLOOKUP, INDEX/MATCH, and the conditional functions. Practice building basic to multi-criteria formulas that you can reuse later in dashboards.
Tip: Always test formulas on a subset of data to verify correctness. - 4
Explore dynamic arrays
Experiment with FILTER, SORT, UNIQUE, and SEQUENCE to simplify complex calculations. Replace long nested formulas with concise array-based expressions.
Tip: Name complex array formulas to improve readability. - 5
Connect with Power Query
Learn to pull data from CSV, text files, and web sources, then apply transformations and load results into Excel for analysis.
Tip: Use query folding where possible to keep performance high. - 6
Build a simple data model
Create a structured data model using tables, named ranges, and data validation. Link multiple sheets and organize inputs, calculations, and outputs.
Tip: Keep the model modular so you can reuse components. - 7
Design a dashboard
Select visuals that tell a clear story, add slicers for interactivity, and ensure alignment of scales and labels. Connect charts to your data model and test with real scenarios.
Tip: Use a consistent color palette and avoid chart clutter. - 8
Add automation with macros
Record or write simple macros to automate repetitive steps, such as refreshing data, applying formatting, or generating reports.
Tip: Test macros on a copy of the workbook before using in production. - 9
Validate and share
Check results with stakeholders, document assumptions, and create a concise narrative to accompany your dashboard. Seek feedback and iterate.
Tip: Include a short “method” section with formulas and data sources.
People Also Ask
What is the difference between Excel and Advanced Excel?
Excel covers basic spreadsheet skills, while Advanced Excel adds powerful features like dynamic arrays, Power Query, and automation. Together they form a continuum for data analysis.
Excel handles basics; Advanced Excel augments with dynamic arrays, data connectivity, and automation to handle complex tasks.
What are essential functions to learn first?
Start with SUM, AVERAGE, COUNT, IF, and then move to XLOOKUP, INDEX-MATCH, and the logical and statistical functions. These form the core toolkit for most analyses.
Begin with SUM, AVERAGE, IF, and then learn XLOOKUP and INDEX-MATCH for flexible lookups.
How do I start building dashboards in Excel?
Plan your questions, choose visuals that fit, connect charts to a single data model, and add slicers for interactivity. Start simple and iterate based on stakeholder feedback.
Start by outlining questions, pick the right charts, and link them to clean data; then add interactivity.
Can I automate tasks in Excel without VBA?
Yes. Power Query automates data prep and parameterized queries; Excel formulas and named ranges automate calculations, and Office Scripts offer cross-platform automation.
Automation can be done with Power Query and built-in formulas; VBA is optional for deeper automation.
Which version of Excel is best for advanced features?
Using the latest available version gives you access to dynamic arrays, Power Query, and performance improvements essential for advanced workflows.
Go with the newest Excel version to take advantage of advanced features like dynamic arrays.
Watch Video
The Essentials
- Master both foundational and advanced Excel to scale analyses
- Clean data and validate formulas before building dashboards
- Leverage dynamic arrays and Power Query for efficient workflows
- Automate repetitive tasks with macros for consistency
- Document models and decisions to improve collaboration