Python in Excel: Practical Integration Guide
Learn how to run Python in Excel, exchange data between Python and spreadsheets, and build powerful data analyses with pandas directly in your workbook. Step-by-step guidance, best practices, and real-world examples.

You will learn how to run Python in Excel, connect a Python environment, write and execute a simple script, and pass data between Python and Excel. This guide covers setup, core workflows, and practical examples to boost data analysis in Excel with Python. Expect hands-on steps, tips for debugging, and safety warnings for file access.
What is Python in Excel?
According to XLS Library, Python in Excel lets you run Python code directly inside a workbook, bridging data science with the familiar spreadsheet interface. This integration enables you to bring powerful libraries like pandas, NumPy, and matplotlib into your daily Excel workflows—without leaving the grid. It supports reading data from cells into Python structures, performing transformations, and returning results back to Excel for immediate inspection. By combining Python's rich ecosystem with Excel's data organization, you can tackle tasks that were tedious or slow with formula-only approaches. This article uses concrete examples to show you how to set up, run, and iterate on Python-powered analyses within Excel. The goal is to make Python in Excel approachable for both aspiring data professionals and seasoned analysts.
Why use Python with Excel?
Python brings scalable data processing, a vast library ecosystem, and more flexible control over data flows than traditional Excel formulas alone. For routine cleaning, transformation, and analytics, Python code can be shorter and easier to maintain than nested Excel functions. You can load large CSVs, merge datasets, apply machine-learning-ready preprocessing, and generate charts—all from a single workbook or notebook-like workflow. The integration also opens automation opportunities: schedule updates, refresh analyses, and produce reproducible reports. According to XLS Library analysis, teams that blend Python with Excel report faster iteration cycles and clearer audit trails, especially when working with multi-step pipelines. The practical benefit is not replacing Excel, but extending it with code-powered rigor and repeatability.
Prerequisites and setup
To get started, ensure you have a Python interpreter installed on your computer along with a compatible Excel build that supports Python integration. You don’t need to become a full-time Python developer, but a basic familiarity with Python syntax helps. Create a dedicated project folder to organize your scripts, notebooks, and data files. Install essential libraries you plan to use (for example pandas, NumPy, and matplotlib) via your preferred package manager. If you’re on Windows, verify that the Excel feature is enabled in your Office settings; on Mac, confirm compatibility and any platform nuances. As a reference, XLS Library analysis shows that having a consistent environment (Python version, library versions) reduces reproducibility issues and makes collaboration smoother.
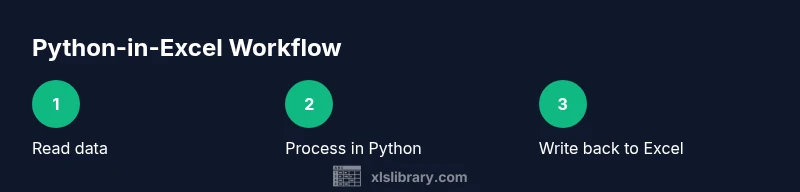
Data exchange model between Python and Excel
The core of Python-in-Excel workflows is data exchange between the workbook and the Python runtime. Typically, you will select a range of cells in Excel and load them into Python as a tabular structure (like a DataFrame). After performing calculations in Python, results are written back to Excel in a new sheet or a dedicated range. You can also create named ranges in Excel for stable data exchange. When dealing with larger datasets, consider streaming data in chunks rather than loading everything at once to avoid memory bottlenecks. Clear data contracts—defining column names, types, and expected ranges—helps prevent type errors and misalignment between Python and Excel.
Common workflows: cleaning, analysis, and visualization
- Data cleaning: remove duplicates, handle missing values, normalize text, and standardize formats directly in Python before pushing results into Excel.
- Transformation and aggregation: group, pivot, and join datasets efficiently with pandas, then export summarizations back to Excel for dashboards.
- Visualization: leverage Python plotting libraries to generate charts, then insert visuals into Excel or export graphics for reports.
- Automation: write scripts that pull fresh data from files or databases, perform the analysis in Python, and refresh the Excel workbook with updated results.
- Validation: add small unit checks in Python to validate data quality before applying formulas in Excel.
These workflows illustrate how Python complements Excel rather than replaces it, enabling more scalable data pipelines within familiar tools.
Practical examples: a mini project from CSV to Excel chart
In this example, you start with a CSV of monthly sales, load it into Python, compute a moving average, and output a two-column table back into Excel, followed by a chart generation step.
- Step 1: Read the CSV into a pandas DataFrame, inspect the columns, and handle missing rows.
- Step 2: Calculate a 3-month moving average to smooth the trend.
- Step 3: Write the result back to a new worksheet in the existing Excel workbook.
- Step 4: Create a simple line chart in Excel linked to the new data to visualize the trend.
This project showcases the end-to-end flow from data ingestion to visualization, all within a single Excel file and Python script.
Troubleshooting and debugging
- Start by confirming the Python environment is reachable from Excel and that the correct interpreter is selected.
- Check data exchange steps: ensure the cell ranges map to the expected DataFrame columns and that data types align.
- Use small, deterministic test datasets to reproduce issues quickly.
- When errors occur, capture error messages and inspect stack traces to identify whether the problem lies in Python code, data formatting, or the Excel API.
- Log outputs in a separate sheet to trace the sequence of operations during a run.
- Keep library versions pinned to avoid breaking changes when sharing workbooks across colleagues.
Authority sources
- https://docs.python.org/3/
- https://www.nist.gov/
- https://learn.microsoft.com/en-us/office/dev/scripts/python-in-excel
Next steps and learning roadmap
To deepen your competency, practice with small projects, expand to more complex datasets, and explore pandas features like merge, groupby, and pivot. Consider building a reusable template that other teammates can adapt. The XLS Library team emphasizes that consistency, documentation, and careful testing are the cornerstones of reliable Python-in-Excel workflows. The XLS Library team recommends starting with a basic read-transform-write pipeline and gradually layering more sophisticated analyses as you become comfortable with the toolchain.
Tools & Materials
- Python interpreter (CPython 3.x)(Install from python.org or via Anaconda; ensure it's on PATH)
- Excel with Python integration support(Requires recent Office build; verify feature availability in your account)
- Pandas, NumPy, and optional libraries(Install via pip in your Python environment)
- IDE or code editor (e.g., VS Code, PyCharm)(Helpful for writing and testing Python scripts)
- CSV/Excel data files for practice(Sample data to experiment with end-to-end)
Steps
Estimated time: Total time: 2 hours
- 1
Set up your Python environment
Install Python and confirm that the interpreter is accessible from your command line. Create a dedicated project folder to organize scripts and data. Install essential libraries like pandas and NumPy so you can manipulate data efficiently.
Tip: Pin versions to maintain reproducibility across machines. - 2
Enable Python in Excel
Open Excel and verify the Python integration feature is enabled in your Office settings. If needed, join the appropriate channel or update to a modern Office build that includes Python support.
Tip: Test a tiny script on a small data range to confirm connectivity before scaling up. - 3
Prepare Excel data for Python
Organize input data in a clean table with headers. Decide on an output region or sheet where results will be written. Use named ranges for stable access from Python.
Tip: Keep a clean data schema: consistent column names and types. - 4
Read Excel data into Python
From Python, load the target Excel range into a DataFrame. Inspect the first few rows to verify correct mapping between Excel columns and DataFrame columns.
Tip: Always validate dtypes early to avoid later conversion errors. - 5
Process data in Python
Apply the required transformations (cleaning, aggregations, feature engineering) using pandas. Keep computations vectorized to maximize performance and reduce loops.
Tip: Document each transformation with comments for future maintenance. - 6
Write results back to Excel
Export the processed DataFrame back into Excel, either as a new sheet or a defined range. Ensure the target area has enough space to accommodate all rows and columns.
Tip: Refresh or clear the destination before writing to avoid stale data. - 7
Create visuals
Option A: Use Excel charts linked to the new data. Option B: Generate plots in Python and import the image into Excel. Choose the method that fits your workflow.
Tip: If embedding Python visuals, save as high-contrast PNG for reports. - 8
Test and debug
Run the entire pipeline on multiple data samples. Review error messages, validate outputs, and adjust data contracts as needed. Maintain a simple log of steps.
Tip: Use small, deterministic test datasets to isolate issues quickly. - 9
Save, share, and iterate
Save the workbook with embedded Python configurations. Share with teammates and collect feedback to iterate on the workflow.
Tip: Provide a readme with environment details and a reproducible runbook.
People Also Ask
What is Python in Excel?
Python in Excel enables executing Python code within an Excel workbook, allowing data processing with libraries like pandas directly alongside cells and formulas.
Python in Excel lets you run Python inside your workbook, so you can use pandas and friends without leaving Excel.
Do I need to install Python separately?
Yes. You should have a Python interpreter installed and accessible from Excel. The exact steps depend on your OS and Office build.
Yes, you’ll need Python installed and accessible from Excel, with platform-specific setup steps.
Can I use Python in Excel on Windows and Mac?
Python in Excel is designed to work on multiple platforms, but there can be feature parity and performance differences. Check your Office version and update notes.
It works on several platforms, but you may see some differences depending on your OS and Office version.
Which libraries can I use with Python in Excel?
You can typically use common data-science libraries like pandas and NumPy. Availability may depend on the environment setup and package management.
You can use popular data libraries like pandas and NumPy, depending on your setup.
What are common errors and how can I fix them?
Errors often arise from data type mismatches, incorrect cell ranges, or missing library versions. Start with small tests, validate inputs, and check environment configurations.
Most errors come from data types or ranges; test with small data and verify your environment.
Is Python in Excel suitable for large datasets?
Performance depends on your configuration. For very large data, consider streaming data or chunked processing to avoid memory bottlenecks.
It can handle large datasets, but you may need to batch processing to keep memory in check.
How do I share Python-in-Excel workflows with teammates?
Create templates with clear environment instructions and data contracts. Include a readme that documents steps, versions, and expected inputs/outputs.
Share a template with environment notes and a simple guide for others to reproduce.
Watch Video
The Essentials
- Run Python in Excel to extend data workflows.
- Set up a stable Python environment to avoid reproducibility issues.
- Define clear data contracts between Excel and Python.
- Leverage pandas for data manipulation inside your workflow.
- Document and test end-to-end workflows before sharing.