Slicing in Excel: A Practical Step-by-Step Guide
Learn how to slice data in Excel using slicers, PivotTables, and data models. This practical guide covers setup, step-by-step actions, tips, and common pitfalls for clean, interactive dashboards.

What slicing in excel means for dashboards
In practical terms, slicing in excel refers to adding visual filters—slicers—to PivotTables, tables, or data models so viewers can focus on specific subsets of data without altering the underlying dataset. When used well, slicers provide an intuitive, interactive way to explore trends, compare segments, and tailor dashboards to different audiences. According to XLS Library, slicing in excel often starts with a data table or a PivotTable, and then extends to multiple charts that respond in real time. The goal is clarity: fewer clicks, faster decisions, and fewer accidental filter errors. Keep your data clean and your field names obvious, and your slicers will become a reliable navigation tool rather than a source of confusion.
When to use slicers vs filters
Slicers and traditional filters both narrow down visible data, but slicers excel in dashboards and reports due to their visual, interactive nature. Use slicers when you want end users to control multiple visuals simultaneously, maintain a consistent filtering context, or provide a single, fan-out control for several PivotTables. Filters are still valuable for ad hoc analysis or when you need to apply temporary, one-off restrictions. In practice, combine slicers for navigation with column filters for in-depth data examination. This separation helps maintain performance and avoids clutter in high-cardinality datasets.
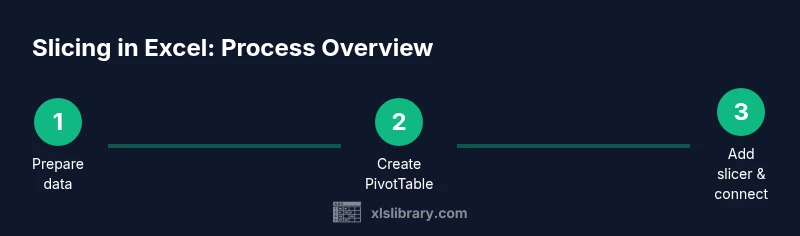
Setting up your first slicer from a PivotTable
Start with a clean table and create a PivotTable (Insert > PivotTable). Add the dimension you want to slice (for example, Region or Product) to the Rows area. Then insert a slicer (PivotTable Analyze > Insert Slicer) and choose the field. The slicer becomes a visual filter that controls the PivotTable immediately. Pro tip: name the slicer clearly (e.g., RegionSlicer) to simplify connections later. This setup is the foundation for interactive dashboards and repeatable analyses.
Connecting slicers to multiple PivotTables and charts
To amplify interactivity, connect a single slicer to multiple PivotTables and charts. Right-click the slicer, select Report Connections (or Slicer > Report Connections in newer versions), and check the PivotTables and charts you want to filter in tandem. This ensures a cohesive filtering experience across your entire dashboard. If you later add new PivotTables, you can extend slicer connections without duplicating effort. Consistency is key to user intuition.
Working with Timelines and Slicers
Date filtering benefits greatly from timelines in Excel. Timelines provide a compact, intuitive way to filter by date ranges, quarters, or months, and they work in tandem with slicers for non-date fields. When you add a timeline to a PivotTable that also uses slicers, ensure your date field is properly recognized as a date type in the source data. Timelines can be linked to multiple PivotTables to preserve synchronized date scopes across visuals.
Best practices for slicer design and usability
Keep slicers visually unobtrusive but easily accessible. Use consistent slicer styles across the dashboard, limit the number of visible slicers, and arrange them near the visuals they affect. Name fields clearly, resize for readability, and consider alphabetical or logical grouping. Avoid burying slicers in menus; visibility directly affects adoption. A well-designed slicer layout reduces user errors and speeds decision-making.
Common pitfalls and how to troubleshoot
Common issues include slicers not filtering all visuals, mismatched data types, and broken connections after workbook changes. Ensure all fields used for slicing are present in each PivotTable, verify data types, and refresh connections when data updates. If a slicer isn’t affecting a chart, check the pivot cache and ensure the slicer’s field is included in the PivotTables’ Filters/Rows areas. Regularly save versions during major dashboard rebuilds to roll back mistakes quickly.
Advanced slicing: data models and Power Pivot
For complex datasets, use the Data Model (Power Pivot) to create relationships between multiple tables and enable slicers to filter across tables. This approach supports more robust dashboards, especially when you need to slice by combined fields (e.g., product + region) without duplicating data. Learning basic DAX measures can further enhance what slicers can drive, such as calculated filters or dynamic metrics.
Real-world examples: sales dashboard slice scenario
Imagine a regional sales dashboard where a Region slicer filters Product, Month, and Customer charts. A single interaction can show regional performance, top-selling products, and month-over-month trends. This scenario demonstrates how slicers reduce cognitive load for stakeholders while preserving full data integrity. By practicing with realistic datasets, you’ll understand how to tune slicers for speed and clarity.
Maintenance and sharing considerations
When sharing workbooks with slicers, test on another user profile to ensure system permissions don’t block connections. Document slicer naming conventions and connection logic so teammates can update dashboards confidently. Periodic checks after data refreshes help catch misaligned fields or broken links before end users notice. Regular backups are your safety net for dashboards that drive business decisions.
Next steps and learning resources
Now that you know the fundamentals of slicing in Excel, build a personal practice dashboard from a sample dataset. Experiment with slicers, timelines, and data model connections. For deeper learning, explore official tutorials and community resources from sources such as Microsoft support and XLS Library tutorials.
mainTopicQuery for Wikidata lookup post-processing