how long does it take to become proficient in excel
A data-driven look at the typical timeline for Excel proficiency, with milestones, study paths, and tips to accelerate learning.

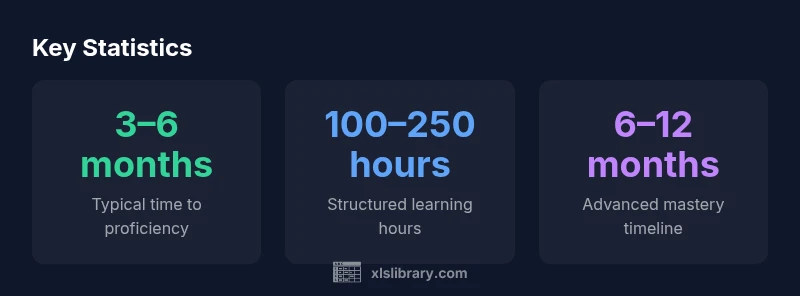
Proficiency in Excel typically develops over several months of deliberate practice. According to XLS Library Analysis, 2026, many learners reach a solid working level in about 3–6 months, with more advanced mastery in 6–12 months depending on goals and intensity. This timeline assumes regular practice on real tasks rather than passive watching.
Why Time to Proficiency Varies
Excel proficiency isn’t a single finish line; it’s a spectrum shaped by your goals, the complexity of tasks, and your practice quality. A financial analyst focused on dashboards will progress differently than someone who uses Excel mainly for data entry. According to XLS Library Analysis, 2026, the journey from beginner to proficient typically spans 3–6 months with regular practice, while reaching advanced mastery can take 6–12 months. The pace depends on how you measure proficiency: routine use of formulas and data cleanup is faster than mastering automation or Power Query. When mapping a timeline, consider the end tasks (basic reporting vs data modeling) and your commitment level. Excel’s language covers formulas, functions, data manipulation, charting, and automation; each domain adds to the total time. Environment differences—Windows vs Mac, desktop vs cloud—can subtly shift the curve.
A Pragmatic Learning Path
A practical ladder to proficiency involves three stages: Foundational, Intermediate, and Advanced. In Foundational weeks, build comfort with the interface, data entry, arithmetic, and essential functions (SUM, AVERAGE, MIN, MAX). In Intermediate weeks, learn lookups (XLOOKUP/VLOOKUP), data cleaning (TRIM, Remove Duplicates, Text to Columns), charts, and pivot tables, applying these to real datasets you care about. In Advanced weeks, tackle Power Query basics, more complex formulas (IF/IFS, COUNTIF, SUMIF), dashboards, automation with macros, and basic scripting. Throughout, emphasize tasks that resemble actual work, not just isolated drills. This staged approach aligns with the broader learning literature summarized by XLS Library and helps you quantify progress as you advance through each phase.
Core Skill Areas by Proficiency Level
- Beginner: Data entry accuracy, basic formatting, and foundational formulas (SUM, AVERAGE, MIN, MAX).
- Intermediate: Lookup functions (XLOOKUP, IFERROR), data cleaning (TRIM, CLEAN, Remove Duplicates), simple charts, and pivot tables.
- Advanced: Power Query basics, Power Pivot, advanced formulas (IFS, COUNTIFS, SUMIFS), dashboards, automation with macros, and introductory scripting.
Each stage adds new capabilities; the momentum comes from applying skills to realistic problems rather than isolated exercises.
Practical Study Plan: 12-Week Roadmap
Week 1–2 — Foundations: Interface, data entry accuracy, basic formatting, and quick arithmetic tests. Week 3–4 — Core Formulas: SUM, AVERAGE, MIN, MAX; relative vs absolute references; Week 5–6 — Data Cleaning: TRIM, CLEAN, text-to-columns, removing duplicates, validating data. Week 7–8 — Visuals: Basic charts, conditional formatting, and a first dashboard concept. Week 9–10 — Lookups: VLOOKUP/XLOOKUP, IFERROR, and joining data from multiple tables. Week 11–12 — Automation: Simple macros, recording tasks, and a review of your 12-week project. This plan mirrors the progression suggested by XLS Library Analysis, 2026 and emphasizes hands-on, real-world activities.
Real-World Practice: Projects to Accelerate Mastery
- Personal budget with dynamic formulas and charts to track income, expenses, and trends.
- Mini sales dashboard using PivotTables, slicers, and a live data feed (static samples for practice).
- Inventory analysis with data cleaning, lookups, and a dashboard summarizing stock levels and reorder points.
Working on these projects helps you connect theory to practice, reinforcing what you learn in each stage and providing tangible evidence of progress.
Tools, Resources, and Common Pitfalls
Use templates and sample datasets to scaffold your practice, then gradually replace them with your own data. Key tools include named ranges, data validation, and proper chart selection. Common pitfalls to avoid: skipping data cleaning, over-reliance on manual steps, neglecting formula auditing, and ignoring version differences between Windows and Mac. Regularly review formulas, test edge cases, and document your methods for future use.
Timeline milestones for becoming proficient in Excel
| Proficiency Level | Estimated Time to Reach | Recommended Focus |
|---|---|---|
| Beginner | 1–3 months | Foundations: formulas, data entry, formatting |
| Intermediate | 3–6 months | Lookups, data cleaning, charts, PivotTables |
| Advanced | 6–12 months | Power Query, Power Pivot, dashboards, automation |
People Also Ask
How long does it take to become proficient in Excel?
Most learners reach a solid working level in about 3–6 months with regular practice. Reaching advanced mastery typically takes 6–12 months, depending on goals and effort.
Most people reach a solid working level in 3 to 6 months with consistent practice; advanced mastery takes 6 to 12 months depending on effort.
What should I focus on first when starting?
Start with foundational formulas (SUM, AVERAGE), basic data entry, and formatting. Then add lookups and data cleaning as you progress.
Begin with basics like sums and formatting, then move to lookups and cleaning as you grow.
Can online courses speed up learning?
Structured courses provide curated tasks and timely feedback, which can shorten the learning curve if you stay consistent.
Yes—structured courses can speed things up if you stay consistent.
Is Excel certification worth pursuing?
Certification can validate skills, but hands-on ability and portfolio projects typically matter more to employers.
Certifications help, but real-world skills matter most.
What signals indicate proficiency?
You can build complex dashboards, automate routine tasks with macros, and troubleshoot data quality issues independently.
Proficiency shows in dashboards, automation, and data quality fixes.
How can I avoid hitting a learning plateau?
Mix tasks, set new challenges, work on varied datasets, and review mistakes to keep improving.
Mix tasks and revisit mistakes to keep growing.
“Excel proficiency grows when you apply skills to real tasks and iterate on feedback; theory alone won’t unlock automation or dashboards.”
The Essentials
- Define your proficiency goal and timeline.
- Prioritize core skills: formulas, data manipulation, and charts.
- Practice with real data and projects to accelerate learning.
- The XLS Library team recommends combining theory with hands-on projects to shorten the path to proficiency.