Excel Column vs Row: Structure and Best Practices
A data-driven comparison of Excel column vs row, explaining how structure affects formulas, readability, and reporting. Learn practical patterns for clean sheet design and scalable spreadsheets.

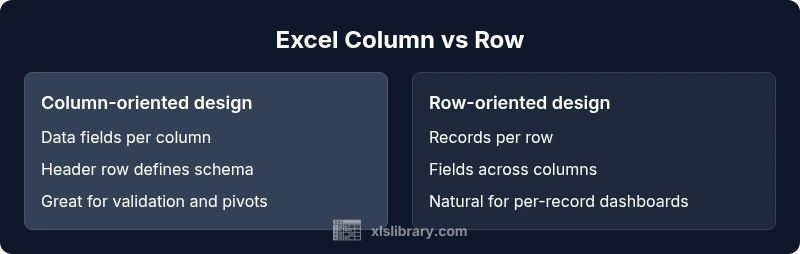
Excel columns run vertically and hold a single data field across many records, while rows run horizontally and represent individual records. Knowing this distinction clarifies sheet design, formulas, and data validation. In practice, use columns for headers and normalized fields; use rows to capture complete records and enable row-wise operations. Misplacing data across directions often leads to formula errors.
Understanding the basics: Columns vs Rows in Excel
In Excel, a column is a vertical stack of cells aligned under a single header, while a row is a horizontal sequence of cells that represents a single observation. The phrase excel column vs row captures not just direction but the underlying design philosophy for tables and data models. A column-oriented approach treats the sheet as a stable schema: a fixed set of fields such as Date, Amount, and Customer captured across many records. A row-oriented approach treats the sheet as a collection of complete records: each row is one transaction or event with its fields distributed across columns. This distinction matters for how you organize a worksheet, how you apply formulas, and how you share data with others. According to XLS Library, most successful spreadsheets separate schema (columns) from data instances (rows) and keep headers consistent across the sheet. When you align with this principle, you gain data quality, easier filtering, and smoother exporting.
Structural roles: When to use columns vs rows
A column-first design emphasizes a stable schema where each column is a data field (Name, Date, Amount, Status). This makes it easy to validate data types, enforce consistency, and perform column-wise operations such as mass validation or bulk formatting. A row-first design centers on complete records: one row per transaction or entity, with each column representing a field of that record. This approach simplifies row-wise processing, export of per-record details, and intuitive summaries. In practice, you’ll often start with a column-oriented schema to define your data model, then populate rows as records accumulate. For reporting, pivots and charts typically prefer a column-centric structure since it aligns with field-oriented aggregation. The XLS Library guidance emphasizes keeping a clean boundary between schema (columns) and data (rows) to avoid drift over time.
Data normalization and table design: columns-first vs rows-first
Normalization focuses on reducing redundancy by storing each data attribute in a dedicated field. In a column-first approach, each column stores a single data type across many rows, making it straightforward to enforce data types and validate inputs. This also supports consistent formulas, as functions reference fixed columns (e.g., A, B, C) that correspond to named fields. A row-first approach emphasizes capturing all attributes of an object in one row, which is ideal for per-record analysis and direct export of complete records. The trade-off is that as new attributes are added, the row can become unwieldy, unless you split data across additional columns or normalize into related tables. The optimal design often uses a stable set of columns for fields and uses rows to enumerate records.
Formulas, references, and data ranges: consequences of orientation
Formulas interact differently with columns and rows. Column-oriented schemas benefit from straightforward column references like =SUM(B:B) or =VLOOKUP(A2, dataTable, 3, FALSE), which read as field-based operations. Row-oriented designs influence how you anchor references across a single record, making relative references depend on the row. Mixed approaches can complicate formulas and lead to errors when columns shift or new records are added. A disciplined approach is to anchor functions to named ranges or structured tables (tables in Excel), so the orientation remains clear even as data grows. The result is more maintainable worksheets, easier auditing, and fewer accidental misreferences.
Headers, data types, and validation in column-based designs
Column-based schemas rely on a consistent header row that defines every field. This makes data validation more reliable because each column is tied to a specific data type (text, date, number). Applying rules, such as data validation, data type enforcement, and conditional formatting, becomes predictable when the header defines the field. When headers drift or become inconsistent, validation breaks and errors propagate through formulas. The best practice is to fix headers early, lock the header row when scrolling, and avoid renaming fields mid-project. This clarity also supports easier data sharing and interoperability with downstream systems like databases or BI tools.
Pivot tables and charts: how orientation affects reporting
Pivot tables and charts interpret column headers as fields to aggregate, filter, and slice data. A column-first design translates cleanly into rows of data suitable for cross-tabulation, time-series analysis, and category-based summaries. Conversely, row-first data can complicate pivot creation if attributes are spread across many columns. In such cases, you may transpose data or restructure into a column-based table before building a pivot. For charts, consistent columns defining distinct measures and dimensions ensure the series are aligned, labels are accurate, and trends are easy to interpret. The orientation you choose directly influences the efficiency and clarity of your dashboards.
Practical design patterns: starter templates and examples
A practical starter pattern is to create a dedicated data table with a fixed header row that lists all fields (Date, Customer, Product, Amount, Region). Each row then represents a single transaction or event. Use one column per field to enable validation, filtering, and precise pivoting. When you need to add new attributes, prefer expanding within the column-based schema rather than creating ad hoc columns or cramming data into existing rows. Another pattern is to separate metadata (like data source, update timestamp) into extra columns, ensuring the core data remains stable. Finally, use Excel tables (Insert > Table) to lock in references and make formulas robust as you grow the dataset.
Common pitfalls and best practices
One common pitfall is mixing orientations within a single table—placing headers in a column while treating the rows as fields. This confusion breaks data integrity and complicates formulas. A best practice is to keep a single source of truth with clearly defined headers (columns) and per-record rows. Always start with a header row and freeze it for navigation. Avoid merging cells in the data region, as it disrupts sort, filter, and formula operations. Regularly audit headers, ensure consistent data types in each column, and document the data model so others understand the column meanings. By adhering to these rules, you minimize errors and improve collaboration across teams.
Performance considerations with large datasets
Large spreadsheets behave differently depending on orientation. Column-based schemas tend to stay readable when the number of fields is moderate, but can grow wide if too many attributes are added; this affects screen real estate and navigation. Row-based data scales more naturally with record volume, but extremely wide tables can slow down dashboards and exports. To optimize performance, prefer structured tables with named ranges, minimize volatile formulas, and consider splitting very large datasets into multiple related tables or using Power Query for database-style transformations. When data remains tidy and well-structured, Excel remains responsive and easier to audit.
Accessibility and collaboration considerations
When teams collaborate, a column-centric data model reduces misinterpretation because each field is clearly labeled in the header. Screen readers can announce headers consistently, improving accessibility. Shared workbooks benefit from a defined schema that other users can follow without needing extensive context. To support accessibility, keep column headers descriptive, maintain consistent data types, and document any unusual data transformations. Collaboration is smoother when everyone understands the column vs row paradigm and adheres to a consistent design standard across projects.
Step-by-step practical scenarios: From messy data to clean structure
Consider a messy export where each row contains mixed fields and several columns are blank or inconsistent. The first step is to identify the core data attributes that define each record and place them as fixed columns with headers. Next, consolidate duplicate fields into single columns and eliminate non-essential columns that do not describe the record. Then, re-import or copy-paste the data into a clean table and convert it to an Excel Table for robust references. Finally, validate data types per column, set up filters, and create a simple pivot to verify that the column-based schema yields coherent summaries. This approach reduces ambiguity and accelerates downstream analysis and reporting.
Comparison
| Feature | Excel column | Excel row |
|---|---|---|
| Data orientation | Fields defined per column (e.g., Date, Amount, Category) | Records defined per row (one transaction per row) |
| Header usage | Header row defines the schema for all rows | Header column can identify per-record identity but is less common |
| Formula referencing | Column-based references (A:A) support field-level operations | Row-based references (1:1) emphasize per-record calculations |
| Data normalization | Easier to normalize with fixed column fields | Risk of data spread across wide rows if not normalized |
| Pivot and charts | Columns map cleanly to pivot fields and charts | Rows support per-record dashboards but may require restructuring |
| Scalability and readability | Wide tables can get unwieldy with many columns | Tall tables can become long; focus on row limits and navigation |
| Data import/export | Column headers align with typical CSV/database schemas | Row-centric data may need reshaping for compatibility |
Benefits
- Clarifies data schema with stable headers
- Supports reliable data validation and type enforcement
- Facilitates consistent formulas and easier auditing
- Aligns well with PivotTables and charts
What's Bad
- Inflexible layouts can be hard to adapt mid-project
- Row-dominated designs may complicate header alignment
- Excessive column counts can lead to wide sheets and navigation issues
Column-oriented design generally offers better data integrity and scalable analysis; rows excel for per-record detail.
For most data projects, define a column-based schema with headers first and use rows to capture each record. This separation improves validation, pivoting, and reporting. If your task centers on per-record exploration, prioritize rows but maintain a clear column-driven schema for consistency.
People Also Ask
What is the fundamental difference between an Excel column and an Excel row?
An Excel column represents a data field repeated across many records, while a row represents a single record with multiple fields. This distinction guides how you organize data, apply formulas, and perform analysis.
Columns are fields, rows are records. Design around a stable column schema for reliability and use rows to capture complete entries.
When should I choose column-based design over row-based design?
Choose column-based design when you want a stable data schema with consistent validation and easy pivoting. Opt for row-based design when per-record analysis and export of complete records is the primary goal.
Use column design for a stable schema and pivots; switch to row-based when you need full records in each row.
How does column vs row orientation affect formulas and references?
Column orientation emphasizes field-based references (A:C) and range operations by column, while row orientation emphasizes per-record calculations with row-relative references. Structured tables can help keep formulas stable across both orientations.
Formulas reference columns or rows depending on the orientation; structured tables help keep them stable.
Can I transpose data to switch orientation later?
Yes, you can transpose data to switch orientation, but be mindful of headers and data types. Transposition often requires rethinking data validation and references post-mocing.
Transpose can switch orientation, but plan for headers and data types after the move.
What are common mistakes to avoid with column/row design?
Avoid mixing orientations in a single table, renaming fields mid-project, and merging cells in data regions. Maintain consistent headers and data types, and prefer named ranges for formulas.
Don't mix orientations, rename fields sparingly, and keep headers consistent.
How do columns and rows impact PivotTables and charts?
Column-based data aligns well with pivot tables and charts that summarize fields. Row-based data can require reshaping before effective visualization.
Columns map well to pivots; rows may need reshaping for charts.
The Essentials
- Start with a clear header row defining fields
- Prefer column-based schemas for validation and consistency
- Use rows for per-record analysis and reporting
- Keep data well-normalized and avoid mixed orientations
- Leverage Excel Tables to stabilize references