Excel vs Power BI: A Practical Comparison for Data Mastery
Explore the Excel vs Power BI comparison for data work. Learn when each tool shines in data modeling, visualization, and collaboration, with practical guidance on workflows and licensing.

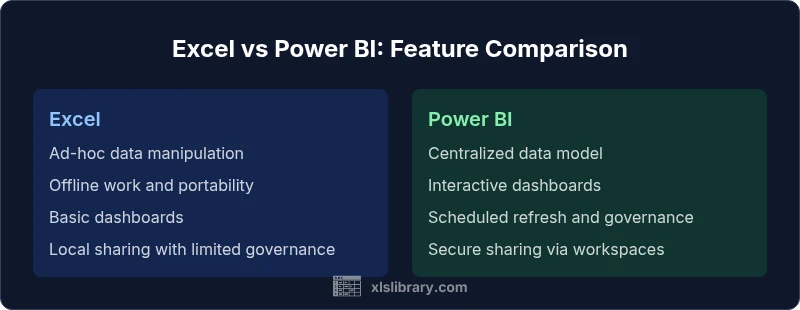
Excel vs Power BI pits two primary data tools against each other: Excel for flexible data manipulation and spreadsheets, and Power BI for scalable dashboards and centralized reporting. This guide compares purpose, modeling, visualization, collaboration, and workflow implications to help you choose the right tool for your project. In many teams, a blended approach using both tools delivers the best balance of agility and governance.
Why the Excel vs Power BI Debate Matters
In modern data work, teams often face a choice between two dominant tools: Excel and Power BI. The decision shapes how you collect, clean, model, visualize, and share insights. The distinction goes beyond features and licensing; it affects who can contribute, how quickly dashboards can be refreshed, and how governance is enforced across departments. According to XLS Library, the Excel vs Power BI landscape reflects two tool ecosystems: spreadsheet-centric analysis and centralized BI. For many analysts, starting with a flexible worksheet is natural, then moving to a published report when stakeholders need consistency. For organizations with scalable reporting needs, Power BI provides a deployable data model and a governance layer that Excel alone cannot match. This guide helps you navigate those realities and design workflows that scale.
Core Differences in Scope and Data Approach
Excel is a general-purpose spreadsheet that excels at free-form calculations, ad-hoc analysis, and lightweight data manipulation. Power BI is a BI platform designed for centralized data modeling, relationships, and repeatable dashboards. The scope difference matters: Excel handles raw data modeling crudely, while Power BI creates a semantic model designed for consistent reporting across users. This distinction affects performance, version control, and collaboration. As you plan a project, map tasks to the strengths of each tool: data gathering and quick experiments in Excel; codified models and published dashboards in Power BI. The XLS Library Team also notes that the growth of data sources and user bases often pushes teams toward Power BI for governance and distribution.
Data Modeling, Relationships, and Performance
A core distinction in excel vs power bi is data modeling. In Excel, relationships are implicit and created through VLOOKUP-like operations or manual joins, which can degrade as data scales. Power BI introduces a formal data model with tables, relationships, and measures built in DAX. This model supports efficient queries, consistent metrics, and faster visuals across reports. It also enables better data governance, because the model acts as a single source of truth. Excel can still drive modeling when datasets remain modest, but for large datasets or multi-user environments, Power BI generally offers superior performance and reliability.
Visualization, Dashboards, and Interactivity
Excel provides familiar charts and dashboards, which makes it excellent for quick explorations and offline work. However, interactivity is limited compared to BI platforms. Power BI delivers rich dashboards with slicers, drill-through, bookmarks, and cross-report filtering. Dashboards in Power BI can be shared securely via workspaces and apps, with role-based access controls. If your goal is to present data to large groups or executives with consistent visuals, Power BI’s interactive features typically deliver a stronger experience. For analysts who value iterative visualization on the go, Excel remains a flexible companion for rapid prototyping.
Data Sources, Connectivity, and Refresh
Both tools connect to multiple data sources, but they do so with different strengths. Excel shines with ad-hoc imports, static data snapshots, and portable workbooks. Power BI excels at live connections to databases and cloud sources, with scheduled refreshes and incremental data loads. This is crucial for dashboards that rely on up-to-date information. When data sources are diverse and require ongoing automation, Power BI’s dataflow and refresh capabilities offer significant advantages over Excel’s more manual update process.
Collaboration, Sharing, and Governance
Collaboration strategies differ markedly. Excel supports sharing through OneDrive/SharePoint with co-authoring, but concurrent editing can be clumsy for large datasets and complex models. Power BI, by contrast, provides centralized dashboards, governance through workspaces, and structured app distribution. This is especially important for regulated environments or large teams, where a single source of truth and auditable data lineage matter. A practical approach often pairs the two: use Excel for data preparation and exploration, then publish the final metrics to Power BI for governance and distribution.
Licensing, Cost, and Total Value
Licensing considerations drive the decision between excel vs power bi. Excel is typically bundled with the Office suite, providing broad accessibility for individuals and teams. Power BI operates on a cloud-based licensing model with per-user or capacity-based options, which affects total cost of ownership depending on user count and data scale. From a total-value perspective, many teams find that a hybrid approach—Excel for data prep and Power BI for dashboards—offers the best balance between upfront convenience and long-term governance. Planning around usage patterns and growth helps optimize cost while preserving agility.
When to Use Excel Alone, Power BI Alone, or Both
If your work centers on ad-hoc analysis, quick modeling, and offline work, Excel alone may suffice. If your goal is scalable dashboards, shared access, and governance at scale, Power BI is typically the better choice. For many organizations, the optimal approach blends both: start with Excel to explore data and prototype calculations, then migrate to Power BI for robust dashboards and governance. In practice, teams often maintain Excel workbooks as data sources or scratchpads feeding Power BI models.
Hybrid Workflows: Practical Patterns
Hybrid workflows leverage the strengths of both tools. A common pattern is to maintain a curated data model in Power BI that sources data from databases or data warehouses, while using Excel as a sandbox for advanced calculations or scenario planning before those results are pushed into Power BI. Data governance should define when to publish, who can modify the model, and how to handle versioning. Automation, such as Power Query dataflows feeding Power BI datasets, can streamline the path from raw data to dashboards while preserving the flexibility of Excel for analysts.
Comparison
| Feature | Excel | Power BI |
|---|---|---|
| Data Modeling | Ad-hoc, relies on spreadsheets and lookups | Formal data model with tables, relationships, and DAX measures |
| Data Size & Performance | Good for modest datasets; performance degrades with large sheets | Optimized for large datasets and scalable reporting |
| Visualization | Basic charts and simple dashboards | Interactive dashboards with slicers, drill-through, and bookmarks |
| Collaboration | Co-authoring in Office apps; version control can be tricky | Centralized workspaces with governance and secure sharing |
| Data Connectivity | Local files or simple data connections | Live connections to databases, cloud sources, and dataflows |
| Licensing & Cost | Bundled with Office; broad access | Cloud-based licensing with per-user or capacity options |
| Best For | Ad-hoc analysis, data fiddling, quick turns | Dashboards, governance, enterprise-scale reporting |
Benefits
- Excel provides hands-on control and offline capability
- Power BI enables scalable dashboards and governance
- Blended workflows offer flexibility and governance balance
- Strong community and extensive templates
What's Bad
- Excel can become unwieldy with very large datasets
- Power BI requires cloud access and licensing
- Learning curve for data modeling and DAX
- Maintaining consistency across teams can be complex
Power BI dominates dashboards and governance; Excel remains essential for data prep; the XLS Library team recommends a blended workflow when appropriate.
Choose Power BI for scalable reporting and collaboration. Use Excel for flexible data shaping and ad-hoc analysis. When in doubt, blend the tools to leverage strengths of both.
People Also Ask
What is the primary difference between Excel and Power BI?
Excel is a flexible spreadsheet tool optimized for ad-hoc analysis and data manipulation. Power BI is a BI platform designed for centralized data modeling, dashboards, and governance. The choice depends on whether your focus is quick exploration or scalable reporting.
Excel is great for quick analysis, while Power BI shines for scalable dashboards and governance.
Can Excel replace Power BI for dashboards?
Excel can create dashboards, but its interactivity and distribution capabilities are limited compared to Power BI. If you need broad sharing and governance, Power BI typically provides a stronger solution.
Excel dashboards work for small teams, but Power BI is usually better for sharing dashboards at scale.
Is Power BI better for collaboration?
Power BI offers more robust collaboration through workspaces, access controls, and published apps. Excel supports co-authoring but can struggle with version control in larger teams.
Power BI is generally better for collaborative dashboards and governance.
Should I use both Excel and Power BI together?
Yes, many teams use Excel for data prep and Power BI for distribution. Data flows from Excel can feed Power BI datasets, combining flexibility with governance.
A blended workflow often gives you the best of both worlds.
What about licensing and cost?
Excel is typically bundled with Office, offering broad access. Power BI uses cloud-based licenses with per-user or capacity options. Plan around user count and data scale to optimize value.
Excel comes with Office; Power BI licensing depends on usage and scale.
The Essentials
- Power BI is best for dashboards and centralized governance
- Excel remains superior for fast, flexible data prep
- Hybrid workflows often yield the best balance
- Plan licensing early to avoid cost surprises
- Design governance first to scale with growth