Difference Between Excel and Power BI: A Practical Guide
A rigorous, analytical comparison of Excel vs Power BI, covering data modeling, visualization, collaboration, and licensing. Learn practical guidelines to decide when to use each tool and how to integrate them for scalable analytics in 2026.

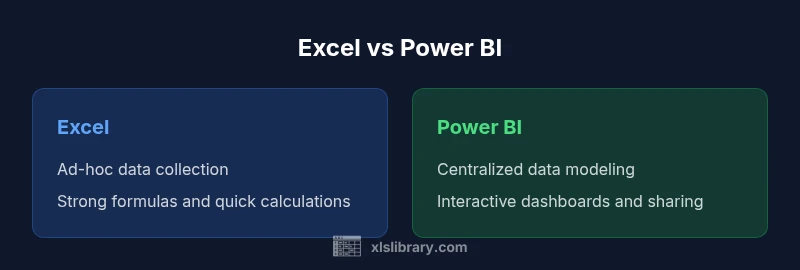
Excel and Power BI serve different but complementary roles in data work. Excel is a versatile spreadsheet for data entry, calculations, and ad-hoc analysis, while Power BI is a dedicated analytics platform for data modeling, visualizations, and interactive dashboards. The difference lies in scope: Excel handles individual workbooks; Power BI scales to enterprise reports and dashboards.
Understanding the Core Roles
In the modern analytics stack, Excel and Power BI occupy different but complementary roles. The difference between Excel and Power BI is not simply a tooling choice; it reflects how organizations plan data workflows, governance, and decision-making. Excel remains the de facto workbook for data capture, ad-hoc analysis, and iterative modeling by individuals or small teams. Power BI, by contrast, provides a scalable platform for modeling data, building reusable datasets, and delivering interactive dashboards to a broader audience. According to XLS Library, most teams start with Excel to collect raw data and perform initial checks, then transition to Power BI to create governance-friendly reports that drive decisions across departments. Beyond tooling choice, the practical difference centers on scale, governance, and velocity of insights. Excel is intimate and fast for personal analysis; Power BI scales insights across people, time, and data sources. When deciding between the two, map your audience, data volumes, and governance needs first, then pick the tool that aligns with those realities. For many organizations, the best outcome is a hybrid workflow: capture and clean data in Excel, then publish a curated model to Power BI for dashboards and governance.
Data Handling and Modeling
The core distinction in data handling lies in data modeling capabilities. Excel offers powerful but primarily user-centric modeling through tables, formulas, and tools like Power Pivot and PivotTables. You can construct relationships, but they are often implicit or manual, and large data sets can cause performance bottlenecks. Power BI, on the other hand, centers data modeling as a first-class discipline. It supports explicit relationships, star schemas, measures using DAX, and a data model that spans disparate sources. This difference matters in practice: Power BI enables you to define reusable datasets, add calculated measures, and enforce data governance through roles and security at the model level. From the XLS Library analysis, organizations that adopt Power BI early tend to realize faster, consistent reporting and fewer ad-hoc data silos. When you need to integrate data from multiple systems—CRM, ERP, cloud storage—Power BI becomes a natural hub, while Excel remains an effective place to stage and prototype analyses before feeding them into the model.
Visualization and Reporting Capabilities
Both tools offer visualization options, but the scope and interactivity differ substantially. Excel provides a broad suite of charts, conditional formatting, sparklines, and dashboards that can be crafted inside a workbook with familiar controls. Yet, when it comes to interactivity, Excel dashboards rely on manual interactions within a single file and can become unwieldy as the data grows. Power BI excels at storytelling with interactive visuals, drill-throughs, slicers, bookmarks, and polished enterprise-grade dashboards. Users can explore data via filtered views, perform what-if analysis, and share live reports across devices. For analysts seeking a 360-degree view of performance across departments, Power BI’s canvas fosters holistic insight, while Excel shines in rapid prototyping and scenario testing. The balance is not one vs the other; it’s how you combine them to amplify your insights while maintaining governance and version control.
Data Connectivity and Sharing
Data connectivity is a foundational difference. Excel connects to local files, cloud drives, and a wide range of data sources through Power Query and add-ins. It remains flexible, but sharing a live dataset for organization-wide analysis is more manually orchestrated. Power BI provides a centralized service with secure sharing, consumption apps, and automated data refresh. It supports direct connections to many sources, including cloud databases, SaaS apps, and streaming data, enabling dashboards that stay current without manual updates. Sharing dashboards in Power BI Service ensures that governance, access control, and version consistency stay intact across the organization. For teams that require a single source of truth, Power BI acts as the data hub; Excel can feed that hub from local workbooks or exported extracts.
Collaboration and Deployment
Collaboration in Excel happens mainly through versioned workbooks stored in OneDrive or SharePoint, with co-authoring features in newer Office scripts. However, concurrent editing can be slow, and governance can be fragmented if multiple people edit copies of the same file. Power BI Service is built for collaboration at scale. Dashboards and reports can be published once and consumed by many users with controlled access, data refresh schedules, and usage analytics. Deployment revolves around licensing and capacity: Power BI Pro licenses enable collaboration, while Premium capacity can host large datasets and distribute content widely. The result is a more controlled, auditable distribution model that reduces the chaos of multiple local copies and inconsistent versions.
When to Pick Excel vs Power BI
Choosing between Excel and Power BI often comes down to the intended audience and the nature of the task. Use Excel for data collection, rapid calculations, and what-if exploration by individuals or small teams. If the goal is to produce repeatable, auditable reports for a broad audience, Power BI is typically the better choice. For hybrid scenarios, start with Excel to clean and prototype data, then move the validated data into Power BI’s data model for scalable dashboards. Budget and licensing considerations also matter: Excel is frequently bundled in Microsoft 365, while Power BI licensing is usage-based for individuals and capacity-based for organizations. Plan a phased migration: pilot in Power BI for a single domain, then extend to other data domains as governance and data quality improve.
Integration: Using Together for Best Results
A key strength of the Excel and Power BI pairing is the ability to leverage the strengths of each tool. You can export a clean dataset from Excel or access it directly as a data source in Power BI via Power Query or the Data View. In Power BI, you can build computed columns and measures with DAX that summarize and analyze the data fed by Excel. This integration allows analysts to start with familiar workbook-driven analysis and then publish centralized reports to a team. Best practices include establishing a standard data schema, using named ranges or tables in Excel, and documenting data lineage so Power BI can reliably refresh data. Regularly validate data quality between the workbook and the BI model to avoid drift.
Practical Scenarios and Case Studies
Consider a mid-sized marketing team that tracks campaign performance across channels. An analyst uses Excel to collect raw data from ad platforms, cleans it with Power Query, and performs preliminary calculations. Then, the data is loaded into Power BI to build a dashboard with interactive filters and executive summaries. Another scenario involves a finance team that maintains monthly budgets in Excel but publishes consolidated reports in Power BI for leadership. In this hybrid workflow, Power BI handles the heavy lifting—data modeling, governance, and distribution—while Excel remains the arena for ad-hoc experimentation and what-if scenarios. These scenarios illustrate how Excel and Power BI complement each other rather than compete.
Authority sources
- https://learn.microsoft.com/en-us/power-bi/ (Power BI official docs)
- https://learn.microsoft.com/en-us/office/excel/ (Excel official docs)
- https://hbr.org/ (Harvard Business Review on dashboards and decision making)
Note: These sources provide guidance on data modeling, visualization, and governance that underpin the practical differences discussed above.
Comparison
| Feature | Excel | Power BI |
|---|---|---|
| Data modeling capabilities | Manual modeling with tables, formulas, and basic relationships | Robust data modeling with relationships, DAX, and measures |
| Data volume handling | Limited by workstation memory; performance can degrade | Designed for large datasets with compression and DirectQuery |
| Visualization and interactivity | Rich charts and dashboards inside workbooks | Interactive, slicable, publishable dashboards in BI Service |
| Data connectivity | Local, CSV, and basic sources via Power Query | Wide connectors to databases, cloud apps, and streaming sources |
| Collaboration/sharing | Manual sharing; co-authoring limited in practice | Secure, role-based sharing in the Power BI Service |
| Scripting and formulas | Excel formulas, VBA support | DAX, M (Power Query) scripting |
| Licensing & cost | Often bundled with Office 365 for individuals | Per-user or capacity-based licensing (Pro, Premium) |
| Best for | Individual analysis, rapid modeling | Enterprise dashboards and governance |
Benefits
- Familiar spreadsheet workflows for fast analysis
- Power BI enables scalable dashboards and centralized reporting
- Strong integration with Microsoft 365 and data sources
- Easy to publish and share dashboards securely
- Good for teams collaborating on single data models
What's Bad
- Excel can struggle with very large datasets
- Power BI has a learning curve for DAX and data modeling
- Excel files can become versioned and inconsistent across teams
- Power BI requires ongoing licensing for cloud sharing
Power BI is the better platform for scalable analytics and enterprise dashboards; Excel remains essential for data prep and ad-hoc analysis.
Choose Power BI when you need centralized data models and repeatable dashboards. Use Excel for rapid data entry, prototyping, and personal analysis, then feed clean data into Power BI for governance and distribution.
People Also Ask
What is the main difference between Excel and Power BI?
Excel focuses on data entry, calculations, and ad-hoc analysis in spreadsheets. Power BI emphasizes data modeling, dashboards, and scalable reporting. They complement each other rather than compete.
Excel is best for quick, in-file analysis, while Power BI excels at scalable dashboards and centralized reporting.
Can Excel and Power BI be used together effectively?
Yes. You can prepare data in Excel and load it into Power BI for modeling and dashboards. Use Power Query to connect to Excel workbooks and publish BI reports.
Absolutely. Use Excel for data prep and Power BI for scalable dashboards.
Is Power BI suitable for small businesses?
Power BI provides free and paid tiers; many small teams benefit from dashboards and cloud sharing. Start with a free idea and upgrade as your governance needs grow.
Yes, with scalable options that fit smaller teams.
What is the learning curve for Power BI compared to Excel?
Power BI requires learning data modeling and DAX, which is a shift from Excel’s worksheet-centric approach. With practice, the curve smooths as you build reusable models.
Power BI has a steeper start, but it pays off with reusable data models.
Do Excel formulas transfer to Power BI?
Excel formulas do not directly translate to Power BI. Power BI uses DAX and M; some concepts map, but reworking formulas is often needed.
No, you’ll translate logic into DAX or M in BI.
How is licensing structured for Power BI?
Power BI offers Free and Pro licenses, and Premium capacity for larger deployments. Most organizations start with Pro and scale as needs grow.
Licensing scales with usage and capacity.
Is Power BI secure for sharing dashboards?
Power BI supports role-based access, secure sharing, and data refresh controls. Security configurations should align with your governance policies.
Yes, with proper governance and access controls.
The Essentials
- Assess data needs to decide between ad-hoc analysis and scalable dashboards
- Leverage Power Query to clean data before modeling in Power BI
- Use Excel for quick calculations and data entry tasks
- Plan a hybrid workflow: raw data in Excel, insights in BI
- Invest in training: learn DAX and data modeling basics