Tableau vs Excel vs Power BI: An Analytical Comparison
A rigorous, analytical comparison of Tableau, Excel, and Power BI to help data teams pick the right BI tool for visualization, data prep, and collaboration.

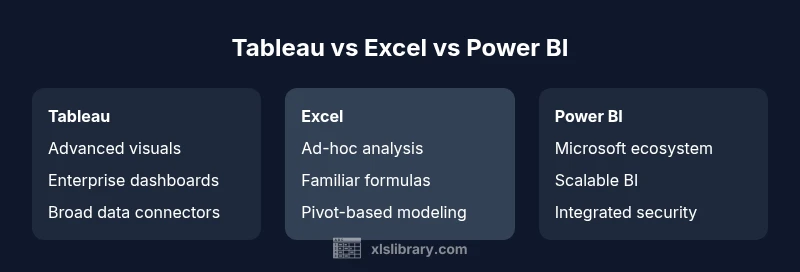
Tableau vs Excel vs Power BI: The best choice depends on your workflow and data strategy. For polished visuals and enterprise dashboards, Tableau often shines. For quick, flexible data exploration in a familiar environment, Excel remains invaluable. For Microsoft-centric teams seeking scalable BI with solid data modeling, Power BI offers strong value and easy sharing. Assess data sources, governance needs, and collaboration requirements to decide.
Market Position and Audience
Tableau, Excel, and Power BI target different user groups within an organization. The landscape favors Tableau for dedicated analytics teams who require rich, interactive visuals and enterprise-grade dashboards. Excel remains the standard tool for many business users who perform ad-hoc analysis, modeling, and quick data tinkering within a familiar interface. Power BI sits between these two poles, offering scalable BI within a Microsoft-centric ecosystem and strong integration with existing data sources. According to XLS Library, understanding tableau vs excel vs power bi requires mapping data needs to the right tool for collaboration, governance, and deployment. This alignment matters most when teams must share insights across departments and maintain data consistency. The result is: choose the tool whose strengths align with your data strategy, governance standards, and organizational workflow.
Core Capabilities: Data Connectivity and Modeling
Data connectivity and data modeling set the foundation for any BI tool. Tableau is renowned for its wide array of connectors to databases, cloud services, and big data sources, plus powerful visual calculations and table calculations. Excel shines in data exploration with pivot tables, formulas, and direct manipulation of datasets that users already manage daily; its connectivity is strong but often relies on imported data or Power Query for ETL-like tasks. Power BI emphasizes seamless integration with the Microsoft stack (Azure, SQL Server, SharePoint, and Excel), with a robust built-in data model, relationships, and DAX calculations. The choice depends on whether you prioritize broad connectivity (Tableau), familiar spreadsheet workflows (Excel), or a deeply integrated Microsoft environment (Power BI).
Visualization and Storytelling Strengths
Visualization capability is where Tableau frequently excels. It offers rich, interactive dashboards, advanced chart types, and flexible storytelling features for data narratives. Excel provides reliable charts and dashboards, but its visualization capabilities can feel less fluid for large, interactive experiences. Power BI balances storytelling with standard visuals, drag-and-drop report creation, and shared dashboards that adapt well to business contexts. For teams that must present insights to non-technical stakeholders, Tableau often delivers the most compelling visuals; Power BI provides strong, shareable BI with practical storytelling in a Microsoft-friendly setting; Excel remains a solid option for quick, on-the-fly visual analyses.
Data Preparation, ETL, and Advanced Analytics
Data prep is foundational for reliable BI. Tableau Prep is designed for guided, visual ETL workflows that prepare data for exploration and visualization. Excel relies on a wide range of built-in functions, Power Query, and manual cleansing, which can be powerful but sometimes error-prone at scale. Power BI uses Power Query as its ETL engine, enabling repeatable data transformations, data shaping, and integration with a broad set of data sources. The choice depends on whether you need formal ETL pipelines (Power BI), lightweight prep that supports rapid exploration (Excel), or dedicated visual ETL that aligns with dashboards (Tableau).
Collaboration, Sharing, and Governance
Sharing insights efficiently is central to BI success. Tableau Server/Online provides centralized governance, versioning, and secure publishing of dashboards. Excel sharing often relies on file-based collaboration (OneDrive/SharePoint) and can raise governance questions if data sources aren’t managed consistently. Power BI Service emphasizes scalable distribution, app-based sharing, and robust governance with data lineage and role-based access. The governance model matters: Tableau excels in enterprise control, Power BI suits Microsoft-aligned organizations, and Excel emphasizes accessibility and rapid sharing among familiar users.
Platform, Deployment, and Ecosystem
Deployment choices vary: Tableau typically deploys on-premises or in the cloud with strong enterprise readiness; Excel is desktop-first with cloud options via Office 365; Power BI is predominantly cloud-native with strong integration into the Azure and Microsoft 365 ecosystems. Platform breadth matters for IT alignment, security, and cross-team adoption. Tableau’s ecosystem shines for large dashboards and data storytelling; Excel remains ubiquitous for everyday analysis; Power BI delivers scalable BI within a familiar enterprise fabric, often reducing integration friction for Microsoft-centric teams.
Pricing, Licensing, and Total Cost of Ownership
Pricing and licensing influence long-term viability. Tableau’s licensing is typically positioned as premium enterprise-grade, with options for server and online deployments. Excel often comes bundled with Office suites, providing a low upfront cost for users already in the Microsoft ecosystem but potentially higher costs when expanding beyond basic features. Power BI is generally perceived as cost-efficient for organizations already investing in Microsoft products, with scalable tiers that support growing data needs. Consider total cost of ownership, including training, governance, and deployment, rather than focusing solely on per-user prices.
Decision Framework: Choosing Among Tableau, Excel, and Power BI
A structured decision framework helps teams pick the right tool. Start with ecosystem alignment: if your organization relies heavily on Microsoft products, Power BI often delivers the best value; if your priority is advanced data visualization and storytelling, Tableau is typically favored; if you need broad accessibility and quick data exploration within a familiar interface, Excel remains compelling. Next, map data sources, governance requirements, and sharing needs. Finally, consider total cost of ownership and the potential for tool sprawl. A practical approach is to pilot one tool per primary use case and track outcomes against business objectives.
Real-World Scenarios and Recommendations
In a mid-size company with a strong MS stack and corporate data lakes, Power BI frequently proves the most cost-efficient and scalable option for standard dashboards and governance. A marketing analytics team prioritizing rich visual narratives may choose Tableau to craft compelling dashboards for executives and stakeholders. A finance or operations group that relies on ad-hoc analysis in a familiar workflow may lean on Excel for rapid experimentation, with occasional exports to Tableau or Power BI for sharing. The key is to avoid tool fatigue by reserving each tool for the scenario where it delivers the most value, while ensuring data governance and consistency across platforms. The result is a balanced toolkit that aligns with business goals rather than pursuing feature parity for its own sake.
Feature Comparison
| Feature | Tableau | Excel | Power BI |
|---|---|---|---|
| Data Connectivity | Wide native connectors to a broad set of data sources | Local files and Power Query connections; strong but varied connectors | Strong connectors to Microsoft services and common data sources |
| Data Modeling | In-database modeling with advanced calculations and table calculations | Pivot tables and formulas; robust for ad-hoc modeling | Built-in data model with relationships and DAX; scalable in large datasets |
| Visualization & Dashboards | Best-in-class visuals and storytelling capabilities | Reliable charts; good for fast dashboards but less flexible for complex visuals | Balanced visuals; strong integration with Microsoft reporting features |
| Sharing & Governance | Enterprise-grade publishing and governance via Server/Online | File-based sharing with co-authoring options; governance depends on process | Cloud-based sharing with Apps; centralized governance and security |
| Learning Curve | Steep when mastering advanced visuals and interactivity | Gentle for Excel users; many features familiar to spreadsheet users | Moderate; familiarity with Microsoft tools accelerates adoption |
| Cost & Licensing | Premium enterprise licensing; higher total cost | Low upfront cost if you own Office; add-ons may be needed for advanced features | Cost-effective in Microsoft-centric environments; scalable pricing |
| Security & Compliance | Strong governance and data lineage in enterprise deployments | Security tied to local data and file-based approaches | Azure AD integration and enterprise security features |
Benefits
- Helps map data needs to the right tool for the organization
- Promotes best practices in visualization, data prep, and governance
- Encourages scalable sharing and governance across teams
- Supports flexible deployment options and ecosystem compatibility
What's Bad
- Can lead to decision paralysis if teams chase feature parity
- Licensing and integration costs can be confusing and high
- Learning curves vary and may slow adoption in some teams
- Migration or coexistence across tools can add complexity
Power BI is often the most balanced choice for Microsoft-centric organizations; Tableau excels in advanced visualization; Excel remains invaluable for quick, ad-hoc analysis.
If your organization relies on Microsoft products, Power BI typically offers the best value and integration. Choose Tableau when visualization depth and storytelling are paramount. Rely on Excel for fast, flexible exploration within a familiar interface. A mixed toolkit aligned to use-cases usually yields the strongest outcomes.
People Also Ask
Which tool is best for data visualization?
Tableau is typically preferred for advanced, interactive visual storytelling. Power BI offers solid visuals well integrated with Microsoft apps, while Excel provides reliable charts suitable for quick, ad-hoc visual needs.
Tableau is usually the top choice for high-end visuals; Power BI is strong for Microsoft-integrated visuals; Excel covers quick charts for everyday use.
Can Tableau be used with Excel data?
Yes. Tableau can connect to Excel workbooks directly or through intermediate data extracts. You can blend or join Excel data with other sources in Tableau to build dashboards.
Yes—Tableau can read Excel files directly and blend them with other data sources for dashboards.
Is Power BI cheaper than Tableau?
In many cases, Power BI offers a more cost-efficient path for organizations already using Microsoft products, but licensing details vary by tier and use case. Tableau often commands higher licensing costs but may deliver deeper visualization capacity.
Power BI is generally cheaper in Microsoft-heavy environments; Tableau can cost more but may justify the visuals premium.
What is the learning curve for each tool?
Excel is familiar to most users and has a gentle entry point. Tableau has a steeper curve for mastering advanced visualizations and interactivity. Power BI sits in between, especially for users already comfortable with Microsoft products.
Excel is easiest to pick up; Tableau takes more time to master visuals; Power BI is a middle ground, especially if you know Microsoft tools.
Can all three be used in the same organization?
Yes. Many organizations adopt a toolbox approach, using Excel for data prep, Tableau for storytelling, and Power BI for scalable enterprise BI within the Microsoft ecosystem.
Absolutely—many teams blend all three to cover different use-cases.
What about data governance and security across tools?
Governance models differ. Tableau emphasizes enterprise governance through Server/Online, Power BI relies on Azure-based security and policy controls, and Excel governance depends on file-based lifecycle and organizational processes. Align with IT policies for best results.
Governance varies by tool; coordinate with IT to apply consistent data policies across Tableau, Excel, and Power BI.
The Essentials
- Define your data strategy before tool selection
- Prioritize ecosystem alignment (Microsoft vs. other ecosystems)
- Evaluate governance needs and sharing requirements early
- Match use-cases to tool strengths: visualization, ad-hoc analysis, or scalable BI
- Plan for training and potential tool sprawl to maximize ROI