Is Excel or Word Better for Flowcharts? A Practical Comparison
Explore whether Excel or Word is better for creating flowcharts, with practical guidance, examples, and scenarios from XLS Library. Learn when data integration, collaboration, and publishing quality matter most.

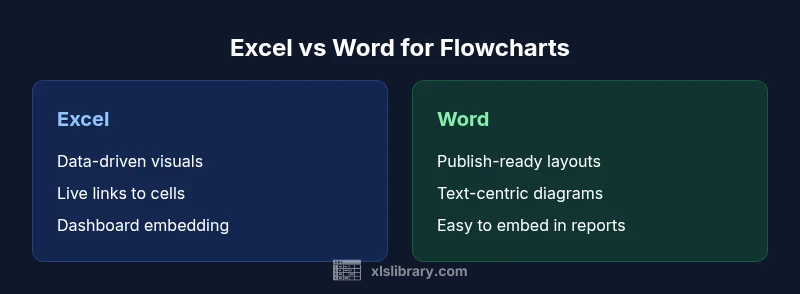
Excel generally offers stronger support for flowcharts that rely on data, formulas, and scalable layouts, while Word excels at document-centric diagrams that prioritize narrative and publishing quality. This comparison helps you decide which tool fits your workflow, based on data needs, collaboration, and output goals. According to XLS Library, many practitioners lean toward Excel for data-driven diagrams, but Word remains valuable for streamlined, publish-ready charts in reports.
Is Excel or Word Better for Flowcharts? A Quick Framing
is excel or word better for flowcharts is a question that often comes up in teams that need both data-driven visuals and polished documents. According to XLS Library, the decision hinges on your primary goal: data integrity and scalability versus narrative clarity and publish-ready formatting. The best answer is seldom a universal rule; it depends on how you plan to use the diagram, who will review it, and where it will live in your documentation pipeline. This section frames the topic and sets expectations for what follows, without assuming a one-size-fits-all solution.
To start: consider whether your flowchart will pull from live data, require frequent updates, or live inside dashboards. If the answer is yes, Excel often provides a smoother path. If your priority is printing, PDF export, or embedding in a report with heavy text, Word can be the more efficient canvas. The XLS Library team notes that many practitioners use a hybrid approach: design data-driven diagrams in Excel and paste or link them into Word for final reports.
This article uses the query "is excel or word better for flowcharts" as a lens to compare tools on common criteria such as data handling, layout control, collaboration, and export options. Remember that the right choice may be a blend of both tools, or a third-party option when scale and collaboration demand it.
continueNoteNeededForEditorsOnlyCheckForConsistencyLaterOnce
Comparison
| Feature | Excel | Word |
|---|---|---|
| Data handling and linking | Excellent for data-driven diagrams with cell-linked values and formulas | Limited for data connections; best for text-heavy layouts and simple visuals |
| Layout and alignment | Grid-based positioning aids precise placement and scaling | Canvas-based drawing with free-form placement; good for narrative layouts |
| Text and formatting | Supports numeric labels, formulas, and dynamic values | Strong text styling for paragraphs, headings, and captions |
| Collaboration and sharing | Works well when diagrams live inside workbooks; supports co-authoring on data models | Co-authoring documents is common in Word; diagrams may be embedded in texts |
| Export and publishing | Export to Excel-friendly formats; easy embedding in dashboards and reports | Export to PDF or Word documents; ideal for polished reports |
| Best for | Data-driven, scalable flowcharts integrated with spreadsheets | Document-centric, publication-ready flowcharts within reports |
Benefits
- Integrated data handling enables data-driven flowcharts
- Easy to update diagrams when underlying data changes
- Strong embedding capabilities for dashboards and reports
- Good for teams that already run Excel-based data workflows
- Supports automation via formulas and simple scripting in Excel
What's Bad
- Word may require more manual layout for large diagrams
- Word lacks native data connections for diagrams
- Complex flowcharts can become unwieldy in a text-focused canvas
- Exporting to other formats may require extra steps or apps
- Not ideal for heavy, data-rich processes without additional tools
Excel is generally the better choice for data-driven, scalable flowcharts; Word is preferable for document-focused, publish-ready diagrams.
Choose Excel when your flowchart needs live data, automation, or dashboard integration. Turn to Word when the priority is clean, narrative-driven diagrams embedded in reports or documents. In some cases, a hybrid approach—designing in Excel and finalizing in Word—delivers the best of both worlds.
People Also Ask
Is Excel better than Word for data-driven flowcharts?
In most cases, yes. Excel provides native support for linking shapes to cell values, using formulas, and refreshing diagrams as data changes. This makes it stronger for processes that rely on data inputs and updates.
For data-driven flowcharts, Excel usually wins because you can link shapes to cells and update automatically.
Can Word handle complex flowcharts well?
Word is well-suited for narrative diagrams that appear in reports or proposals. It offers solid drawing tools and SmartArt, but it lacks built-in data connections. For highly complex, data-heavy diagrams, Word can require extra steps or external tools.
Word is great for narrative diagrams, but it doesn’t natively handle data connections like Excel.
Which is easier for beginners to start with?
Word tends to be easier for beginners who want quick, document-like diagrams without data complexity. Excel requires familiarity with shapes, connectors, and potentially formulas or linked data.
If you’re new to diagramming, Word is usually simpler to start with.
Can I export flowcharts from Excel to other formats easily?
Yes, you can export diagrams from Excel to images, PDFs, or insert them into Word or PowerPoint. If you need a standalone, platform-agnostic diagram, you may export as an image or copy-paste to another tool.
You can export from Excel into common formats and reuse the diagram elsewhere.
What about using dedicated tools like Visio?
For very large, standardized process diagrams, Visio or other dedicated diagram tools can complement or replace both Excel and Word. They offer advanced connectors, templates, and data integrations beyond the Office suite.
If your needs grow beyond Office, consider Visio or other diagram tools.
The Essentials
- Assess your primary goal: data accuracy or narrative clarity
- Excel excels at data-linked, scalable flowcharts
- Word shines for polished, document-ready diagrams
- Embed Excel charts into Word to combine strengths
- Plan output format early to guide your tool choice