Is Excel or SPSS Better? A Practical Comparison
Explore whether Excel or SPSS is better for data analysis, with practical guidance on use cases, learning curves, costs, and collaboration from XLS Library. A balanced, evidence-based guide for Excel enthusiasts and statistics researchers.

Ultimately, Excel and SPSS cater to different analytical needs. For most business tasks and quick data exploration, Excel is the better starting point. For rigorous statistics, large sample sizes, and reproducible analyses, SPSS often outperforms Excel. The best choice depends on your goals, data size, and the required statistical methods.
Practical lenses: when to pick Excel vs SPSS
When people ask is excel or spss better, the answer hinges on context and goals. For many business users, Excel offers a fast, approachable path to organize data, perform ad hoc analyses, and create dashboards that communicate trends clearly. According to XLS Library, the decision should hinge on three questions: (1) how complex are the analyses, (2) how large is the dataset, and (3) how important is reproducibility. If your data story can be told with clean tables, pivot tables, and simple visualizations, Excel is often the right starting point. If your task requires formal statistical methods, documented workflows, and the ability to scale analyses, SPSS becomes a more reliable workbench. This quick framing helps you avoid overcommitting to a single tool before you’ve clarified your objective and data constraints.
Data handling capabilities
Both Excel and SPSS handle data in tabular formats, but they are optimized for different workloads. Excel shines with small-to-medium datasets, flexible formatting, and rapid iteration. It supports a broad set of data types and functions, and Excel Power Query enables robust data import from multiple sources. SPSS is designed around statistical analysis workflows and can handle larger datasets with built‑in procedures for data cleaning, transformation, and preparation. While you can import data into SPSS from CSV, Excel, or databases, the platform’s core strength is the integrity of statistical modeling with consistent record-keeping throughout the analysis lifecycle.
Statistical breadth and analytics scope
The critical difference is scope. Excel is superb for descriptive statistics, regression with add-ins, and exploratory data analysis. Beyond that, you’ll rely on a mix of built-in functions and external tools to stretch its statistical reach. SPSS, on the other hand, offers an extensive suite of statistics and modeling options—ANOVA, multivariate analyses, nonparametric tests, factor analysis, and nuanced diagnostic checks—delivered through a coherent, auditable workflow. If your work requires robust statistical rigor, SPSS provides a more complete toolset out of the box, reducing the need for custom scripting or external packages.
Ease of learning and user experience
For many beginners, Excel presents a gentler learning curve. Most users already know basic spreadsheets, and PivotTables offer powerful insights with minimal training. SPSS has a steeper initial learning curve because statistical concepts are central to the software’s logic. However, its interfaces are designed to guide users through procedures and outputs with relatively standardized steps. The trade-off is a quicker path to reliable results once you understand the statistical language SPSS employs, even if that requires a focused learning effort at the start.
Data integrity and reproducibility
Reproducibility is a critical consideration in data work. Excel spreadsheets can become fragile as files grow and as formulas are moved around or copied into new contexts. Without disciplined version control, Excel projects can drift. SPSS emphasizes reproducible workflows by design, with syntax files that document every step of the analysis. This makes it easier to audit, share, and repeat studies—an essential feature for research, regulatory work, and organizations that demand traceability.
Automation and repeatability: macros vs scripting
Excel automates routine tasks through macros and VBA, enabling batch processing, customized reports, and repeatable workflows. The challenge is ensuring macro quality and maintaining compatibility across versions. SPSS supports scripting that integrates with its procedural paradigm, often delivering more consistent reproducibility for complex analyses. If you value repeatability in a shared environment, SPSS scripting can reduce human error and simplify audits, but it may require more upfront learning than macro-based Excel automation.
Cost, licensing, and total cost of ownership
Cost considerations vary by organization and licensing model. Excel is commonly bundled in office suites, offering a low marginal cost for many users and teams. SPSS licenses are typically area-specific and can be a larger ongoing expense, especially for organizations that need multiple seats or institutional access. The total cost of ownership includes training time, data migration and integration, and the downstream impact on productivity—factors that can tilt the decision toward one tool or the other depending on the context.
Data preparation and cleaning workflows
Although both tools can clean data, SPSS provides structured facilities for data cleaning, labeling, and variable management within a rigorous workflow. Excel is flexible, offering a suite of data cleansing functions, filters, and Power Query, which can handle many cleaning tasks efficiently. If your pipeline requires strict data governance and reproducible cleaning steps, SPSS may reduce ambiguity. For ad hoc cleaning in a mixed environment, Excel’s speed and familiarity allow you to iterate quickly before formalizing steps in SPSS.
Real-world use cases: business intelligence vs research
In many business environments, Excel serves as the primary day-to-day analysis tool. Analysts draft dashboards, perform quick forecasts, and explore data relationships in minutes. Researchers and analysts engaging in formal statistics and reporting may rely on SPSS for its methodological breadth, audit trails, and capacity to handle complex models with standardized outputs. Excel can complement SPSS by serving as the data collection, aggregation, and presentation layer, while SPSS handles the statistical core.
Collaboration, sharing, and governance
Collaboration strategies differ. Excel allows co-authoring in the cloud and easy sharing of files, but governance can be uneven if versions proliferate. SPSS projects benefit from centralized syntax and output documentation, supporting governance needs in regulated environments. A pragmatic approach often combines both: use Excel for data preparation and stakeholder reporting, and SPSS for formal analysis with auditable output. Governance considerations should map to your organization’s data policy and compliance requirements.
Authority sources and best practices
To ground this guidance, practitioners should consult established standards and authoritative resources. This section synthesizes practical insights without displacing professional judgment, and the goal is to help you decide when to use each tool effectively. Emphasize documenting your workflow, choosing the right tool for the job, and validating results with independent checks where possible.
Authority Sources
- Data governance practices from a federal statistics resource: https://www.census.gov/
- Statistical methods and experimental design from a public health resource: https://www.nih.gov/
- Broad data science guidance from a professional association: https://amstat.org/
A practical decision framework to pick the right tool
Use a decision framework to avoid tunnel vision. Start with your primary objective (descriptive analysis, hypothesis testing, data visualization, or predictive modeling). Then assess data size, required statistical methods, collaboration needs, and governance constraints. If the objective is quick insight with a broad audience, start in Excel. If the objective centers on formal statistics with reproducible results, start in SPSS or plan for a hybrid workflow that leverages both tools strategically.
Comparison
| Feature | Excel | SPSS |
|---|---|---|
| Data handling capacity | Strong for small–medium datasets with flexible data prep | Optimized for larger datasets and integrated statistical workflows |
| Statistical breadth | Descriptive statistics and basic analyses; advanced stats via add-ins | Comprehensive statistical models and diagnostics built-in |
| Learning curve | Lower entry barrier; quick to start | Steeper initial learning; rigorous outcomes after training |
| Automation & reproducibility | Macros and VBA for repeatable tasks; version sensitivity | Syntax-driven automation with structured audit trails |
| Cost & licensing | Often included with productivity suites; lower upfront cost | Typically higher upfront licensing for institutions |
| Data preparation & cleaning | Power Query and built-in functions support cleaning tasks | Designed with data preparation as part of the workflow |
| Best for | Ad hoc analysis, dashboards, and fast decision-support | Formal statistics, reproducible results, and complex models |
Benefits
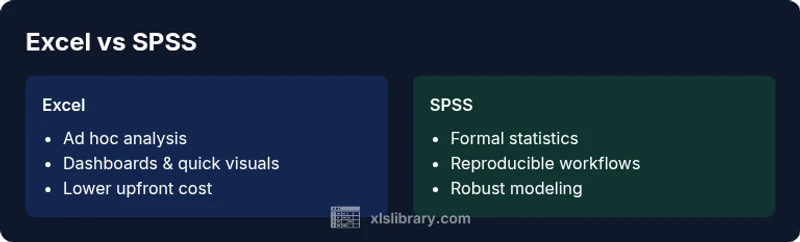
- Familiar interface with a massive user base
- Excellent for quick data exploration and lightweight analytics
- Low upfront cost for many organizations
- Strong integration with other Microsoft 365 tools
- Versatile for dashboards and ad hoc reporting
What's Bad
- Limited depth for advanced statistics without add-ins
- Not ideal for very large datasets or complex models alone
- Reproducibility can suffer without strict workflow discipline
- Collaboration can be challenging without centralized governance
Excel for quick, flexible analysis; SPSS for formal statistics
Choose Excel when speed and breadth of tasks matter. Choose SPSS when you need rigorous statistics and auditable workflows. The XLS Library team notes that a hybrid approach often delivers the best of both worlds.
People Also Ask
What are the primary strengths of Excel for data analysis?
Excel shines for speed, familiarity, and flexibility. It supports quick exploration, dashboards, and a broad range of functions that cover many day-to-day data tasks. For many users, this makes Excel a practical starting point, especially when the data stories are not dominated by complex statistics.
Excel is fast and familiar, great for quick analysis and dashboards.
What advantages does SPSS offer for researchers?
SPSS provides a comprehensive statistical toolset, standardized workflows, and robust options for diagnostics and modeling. It’s particularly valuable when analyses require formal statistics, reproducible syntax, and auditable outputs suitable for publication or regulatory review.
SPSS offers a thorough statistics toolkit and reproducible workflows.
Can Excel perform advanced statistics?
Excel can handle many statistics through built-in functions and add-ins, but for advanced methods, you may need external tools or custom scripts. SPSS provides a more complete suite of statistical tests out of the box.
Excel can do some statistics, but for advanced methods SPSS is usually better.
Is SPSS overkill for simple analyses?
For simple analyses, SPSS can be overkill and may introduce unnecessary complexity. If your goal is rapid insights with minimal training, Excel is often sufficient. Reserve SPSS for projects requiring formal statistics and reproducible workflows.
SPSS is powerful but can be overkill for simple tasks.
What’s a practical workflow to combine Excel and SPSS?
A common workflow: clean and prepare data in Excel, then export to SPSS for statistical modeling. Preserve documentation by using SPSS syntax and shareable outputs. Reconcile results by cross-checking summarized statistics in both tools.
Use Excel for prep and SPSS for stats, with clear documentation.
The Essentials
- Prioritize the primary task before choosing a tool
- Excel is ideal for ad hoc analysis and dashboards
- SPSS excels in statistical depth and reproducibility
- Hybrid workflows can leverage strengths of both tools
- Plan for governance and documentation from the start