Why Use Excel Over Python: A Practical Comparison
Explore when Excel beats Python for quick analysis and dashboards, and when Python is better for automation and scalability. A balanced, analyst-focused comparison from XLS Library.

Excel remains the fastest way to explore small to medium datasets and create shareable dashboards, especially for non-programmers. Why use excel over python? This quick comparison highlights where Excel shines for quick insights and where Python excels at automation and scale. According to XLS Library, the best choice depends on task complexity, team skills, and the need for repeatable workflows.
Why Excel Remains a Practical Choice in a Python-Dominated World
For many teams, Excel is not a relic but a practical starting point for data tasks. It offers immediate feedback through in-cell formulas, pivot tables, and dashboards, without requiring programming. Why use excel over python? The answer starts with accessibility: Excel lowers the barrier to entry, reveals data patterns quickly, and enables non-technical stakeholders to explore what-if scenarios in real time. According to XLS Library, many organizations begin data work in Excel because it’s familiar, fast to adopt, and integrates with existing workflows. This section examines the contexts where Excel continues to deliver value and how it complements more scalable tools in the toolbox. While Python offers raw power for data science, Excel remains deeply embedded in business processes: budgeting, forecasting, and operational metrics. The discussion below explains why teams often default to Excel for day-to-day analysis and how to avoid common traps that push analysts toward code too early.
When Excel Shines: Use Cases Where It Excels
Excel shines in scenarios where speed to insight matters, datasets are manageable in memory, and business users need to interact with models directly. Monthly dashboards, what-if scenario analysis with data tables, and financial models built in a familiar interface are classic Excel tasks. You can sketch a revenue forecast with simple assumptions, create pivot tables to summarize regional performance, and share the workbook with colleagues who can inspect formulas without running a Python script. In these contexts, Excel reduces friction, supports collaboration, and provides a transparent trail of calculations. The XLS Library analysis shows that many teams begin exploratory work in Excel before migrating to Python for automation or large-scale tasks.
Understanding the Limitations: When Excel Falls Short
Even with powerful features, Excel has boundaries. Size and performance degrade as spreadsheets grow beyond comfortable limits; complex data cleaning pipelines can become fragile, with dependencies spread across many cells. Excel’s scripting options (VBA or Office Scripts) can automate repeats, but they often lack the robust version control, testing, and modularity that code offers. As teams scale, maintaining consistency across dozens or hundreds of workbooks becomes challenging, and governance gaps can emerge. In these situations, Python provides repetition, reproducibility, and the ability to manage data pipelines end-to-end. The point is not to abandon Excel, but to recognize when its strengths give way to the needs of larger datasets and formalized processes.
The Python Advantage: Automation, Scale, and Reproducibility
Python excels at automation and scalable data processing. It handles large datasets more efficiently, supports reproducible workflows via scripts and notebooks, and integrates with databases, data warehouses, and cloud services. For analysts who want version-controlled code, automated testing, and reusable data transformation pipelines, Python offers a powerful toolkit. Yet, this power comes with a learning curve, setup overhead, and the need for a development environment. The key is understanding that Python is not a replacement for Excel in all situations, but a complement for repeatable tasks, data transformation, and advanced analytics. When the goal is to produce a repeatable report or an ETL pipeline, Python often wins in the long run.
Practical Workflow Design: Blending Excel and Python for Best Results
Smart workflows blend the strengths of both tools. Start with Excel for quick exploration, hypothesis testing, and stakeholder-friendly dashboards, then move to Python to automate cleansing, complex transformations, or to scale pipelines. A common pattern is to export a clean dataset from Excel to Python, where scripts perform repeatable transformations, validation, and integration with databases. You can maintain Excel as the human-facing interface for inputs, parameters, and ad-hoc analysis, while using Python behind the scenes to ensure consistency, auditability, and reproducibility. Design modular steps, document assumptions, and use version control for both workbook templates and Python scripts.
Data Visualization and Dashboards: Excel's Strengths and Python's Libraries
Excel dashboards benefit from native charts, conditional formatting, sparklines, and pivot-driven summaries that are instantly visible in a shared workbook. For many business users, a well-crafted Excel dashboard communicates insights without requiring software installation beyond Office. Python, by contrast, offers powerful libraries for advanced visualization and interactive dashboards in notebooks and web apps, but that sophistication usually requires developers or data teams. As noted by XLS Library analysis, teams frequently rely on Excel for initial visual storytelling, then layer in Python for deeper analytics where needed.
Data Cleaning and Transformation: Where Excel Helps, Where It Doesn't
Excel provides accessible data cleaning techniques: trimming whitespace, removing duplicates, and applying data validation rules. However, as data sources multiply and quality concerns grow, dedicated data cleaning pipelines in Python or SQL often outperform manual spreadsheet workflows. Excel supports basic ETL-like steps, but it’s not a substitute for robust data pipelines, automated checks, and reproducible transformations across multiple data sources. A practical approach is to keep data cleaning in a controlled environment (Python or SQL) and use Excel primarily for inspection, ad-hoc adjustments, and final presentation-ready outputs.
Collaboration, Governance, and Risk Management in Excel-Heavy Environments
Collaboration in Excel relies on shared workbooks or cloud-based files, which can lead to version conflicts if not managed carefully. Governance practices—such as standardized templates, data validation rules, and documented calculations—help maintain credibility. Risk factors include manual errors, inconsistent assumptions, and opaque data lineage. Mitigation strategies include centralized templates, shared data sources, clear auditing trails, and occasional migration to code-based workflows for critical processes. The XLS Library recommends standing up governance practices that balance flexibility with guardrails so teams can operate with confidence.
Cost of Ownership and Skill Development: A Practical Roadmap
From a cost perspective, Excel often requires lower upfront investment, especially in organizations already using Office. The ongoing cost focuses on license management, template governance, and user training. For Python, consider the total cost of ownership across development environments, libraries, and support, with potential savings from automation and reduced manual effort. A practical learning path combines targeted Excel certifications with foundational Python data skills, applied to real business problems. The roadmap should align with team maturity, data volume, and the organization's data strategy.
Comparison
| Feature | Excel | Python |
|---|---|---|
| Learning curve and setup | Low; quick to start | Medium to high; requires setup and environment |
| Data size and performance | Best for small–medium datasets in memory | Handles large datasets and pipelines |
| Automation and reproducibility | Manual via macros/templates | Full automation with scripts and version control |
| Ecosystem and tooling | Rich built-in features, templates, add-ins | Extensive libraries and tooling for data science |
| Collaboration and sharing | Workbook sharing; familiar to many teams | Code and notebook sharing via repositories |
| Visualization capabilities | Native charts and dashboards in workbooks | Advanced visualizations via libraries (export required) |
| Cost and licensing | Often included with office suite | Depends on environment; may require setup and licenses |
Benefits
- Low upfront cost for many teams
- Immediate visual feedback and sharing
- Strong in-cell formulas and templates
- Familiar interface reduces ramp-up time
What's Bad
- Limited scalability for very large datasets
- Automation can be fragile without coding
- Version control challenges in shared workbooks
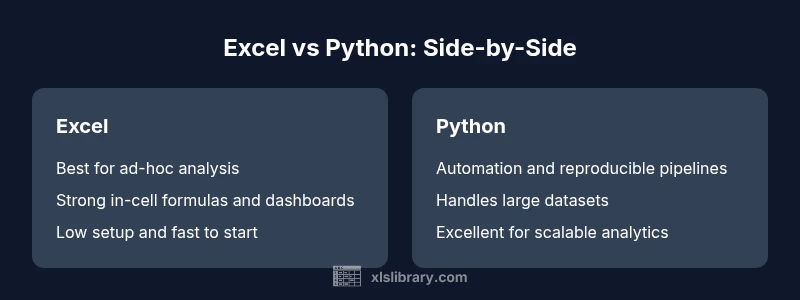
Excel is the practical default for quick analysis and dashboards; Python is superior for automation and large-scale data.
The XLS Library team recommends using Excel for rapid insights and collaborative work on smaller datasets. For automation and scalability, lean on Python. A blended approach often yields the best results.
People Also Ask
Can Excel truly compete with Python for data science tasks?
Excel covers basic analytics well and supports fast iteration, but Python offers deeper modeling, automation, and scalable data processing. For most data science tasks, Python provides more robust tooling and reproducibility, while Excel remains ideal for quick insights and stakeholder communication.
Excel handles quick analytics; Python provides robust data science capabilities for larger, repeatable tasks.
When should I start using Python over Excel?
If your work requires automated data pipelines, large datasets, or complex transformations, Python is the better long-term choice. Start with Excel for exploration, then migrate to Python when automation and scale become priorities.
Use Python when automation and scale outweigh ease of use.
How can I share Excel analyses with non-Excel users?
Shareable Excel workbooks with clear documentation and data sources help non-Excel users. Consider exporting results to CSV or creating dashboards in Power BI or Tableau to broaden accessibility while preserving the original Excel models.
Share workbooks or export results to accessible formats for broader audiences.
Is VBA enough for automation, or should I move to Python?
VBA is useful for simple, workbook-level automation, but Python offers more robust development workflows, library support, and version control. For scalable automation, plan a path from VBA to Python or integrate both where appropriate.
VBA is good for small tasks; Python excels for scalable automation.
Are Excel dashboards sufficient for business intelligence?
Excel dashboards can be effective for many business needs, especially for quick decisions and frontline insight. For complex BI requirements, consider supplementing with Python-driven pipelines and data visualization platforms for broader accessibility.
Excel dashboards work for many needs, but larger BI may require additional tools.
The Essentials
- Start with Excel for quick exploration and dashboards
- Use Python for automation and large-scale data tasks
- Blend both tools to maximize efficiency
- Invest in governance and training to reduce risk