Is Excel or Python Better for Data Analysis? A Practical Comparison
An objective, data-driven comparison of Excel vs Python for data analysis, covering use cases, learning curves, scale, and practical workflow guidance.

For most professional data-analysis tasks, Python is the better long‑term choice due to scalability, automation, and reproducible workflows, while Excel remains unbeatable for quick ad‑hoc analysis and stakeholder-friendly dashboards. The best approach depends on your data size, team skills, and project goals: use Python for complex pipelines and heavy lifting; use Excel for fast prototyping and tangible results you can share instantly.
Why the Excel vs Python debate matters in data analysis
In modern analytics, teams frequently ask: is excel or python better for data analysis? The short answer depends on context, but the broader truth is that both tools play vital roles in a data-driven workflow. According to XLS Library, choosing between these platforms is less about one being universally superior and more about matching capabilities to the task at hand. This article uses a structured comparison to unpack where each tool shines and where it falters, with concrete examples and pragmatic thresholds. By understanding where Excel excels and where Python shines, you can design a pragmatic stack that moves from quick insights to scalable, repeatable analytics. The balance between speed and reliability is key: use Excel for fast exploration and presentation, and reserve Python for reproducible pipelines, complex transformations, and automation. If you’re asking is excel or python better for data analysis, the answer is usually: use both, at the right time, with clear handoffs and version control.
Core differences in workflow, scalability, and cost
The core decision point rests on workflow design, data scale, and the long-term maintenance of your analytics process. Excel provides a familiar, interactive interface with immediate visual feedback, making it ideal for rapid prototyping, data cleaning checks, and ad-hoc reporting. Python offers scripting, modular functions, and a thriving ecosystem that supports automation, reproducibility, and scalable analyses across terabytes of data (in practice, many teams start with smaller samples and scale up). When evaluating total cost of ownership, consider not just software licenses or open-source payments, but also time to onboard, debugging overhead, and the value of reproducible results. The XLS Library analysis shows that teams adopting Python for core pipelines often realize lower maintenance costs over time, while Excel remains cost-efficient for one-off analyses and stakeholder-ready deliverables. Still, the choice is not binary; many organizations run a hybrid model where analysts begin in Excel and extract, transform, and load (ETL) steps in Python. In both cases, establishing clear data dictionaries, versioned notebooks or scripts, and standardized reporting templates helps prevent drift and confusion across teams.
When Excel shines: ad-hoc analysis, rapid prototyping, and familiar UI
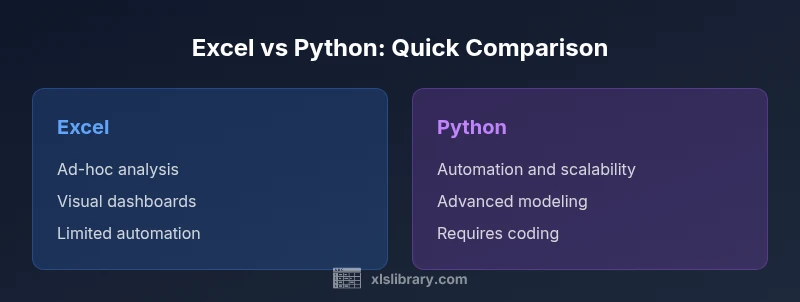
For many business contexts, Excel is the fastest path from data to insight. The grid layout mirrors typical business tables, making it easy to perform quick calculations, pivot analyses, and sensitivity checks without leaving the spreadsheet. Advanced users can leverage built-in features like conditional formatting, data validation, and pivot tables to illuminate trends with minimal setup. However, Excel’s strength is also its Achilles’ heel: as datasets grow beyond a few hundred thousand rows or when multiple people edit a workbook simultaneously, errors multiply and audit trails become murky. Still, when you need to present a compelling numbers story to non-technical stakeholders, Excel’s visual clarity and familiar charts often trump more abstract Python outputs. In low‑stakes projects or quick executive summaries, Excel remains a reliable workhorse. A practical rule of thumb is to start with Excel for exploration, then migrate the reproducible parts to Python if the analysis becomes mission-critical. The balance between speed and reliability is the key to maximizing Excel’s value in real-life data tasks.
When Python shines: automation, scalability, advanced modeling
Python enables repeatable data workflows through code, which is essential for teams facing large datasets or complex transformations. With pandas and other libraries, analysts can clean, enrich, and merge data at scale, run machine learning models, and generate reports automatically. Python scripts can be version-controlled with Git, tested with unit tests, and scheduled with workflow managers, reducing the likelihood of manual errors that creep into Excel workbooks. For data science tasks such as feature engineering, clustering, or forecasting, Python’s ecosystem provides a rich toolbox that evolves with the field. The trade-off is learning curve and setup time. New users must become comfortable with syntax, debugging, and environment management. Nonetheless, the long-term payoff is reproducibility, faster iteration cycles, and the ability to handle streaming data or APIs. The key is to start small, develop modular scripts, and gradually increase coverage with automated validation and documented design decisions.
Practical guidelines: choosing based on data size, team skills, and project goals
To decide which tool to rely on, start with four criteria: data size, required speed of delivery, complexity of analysis, and collaboration needs. For datasets under a few hundred thousand rows with straightforward transformations, Excel often delivers rapid insights with minimal friction. If the team includes programmers or data engineers, and the task involves repeated processing, multiple data sources, or model deployment, Python becomes the stronger backbone. Consider also the lifecycle of the project: exploratory work benefits from Python’s notebooks and version control, while final reporting and dashboards may require Excel or BI tools for stakeholder engagement. Consider a hybrid workflow: prototype in Excel, then extract the logic to Python, ensuring both environments share a common data dictionary and consistent naming conventions. Finally, factor in learning curves, training resources, and organizational constraints such as licensing costs and IT policies. The objective is a repeatable, auditable process that yields reliable insights regardless of the tool.
Common pitfalls and how to avoid them
A frequent pitfall is treating Excel as a permanent data store; spreadsheets are prone to drift, formula errors, and version conflict. Counter this with a clear data dictionary, controlled templates, and regular audits. In Python, blind reliance on one-off scripts can create brittle pipelines if dependencies or data schemas change; guard against this with dependency management, parameterization, and modular design. Another challenge is the difference in testing: Excel calculations can be hard to test, whereas Python code invites automated tests and continuous integration. Finally, both tools can suffer from data leakage and improper handling of missing values; implement robust cleaning steps and validation checks early in the workflow. By anticipating these issues and establishing guardrails, teams can reduce rework and maintain confidence in their results.
Case studies: lightweight scenarios for Excel vs Python
Consider a marketing analyst who needs to summarize campaign performance in a weekly report. Excel offers fast aggregation, pivoting, and charts that executives can interpret at a glance. In contrast, a data team reviewing customer journeys across platforms might build a Python pipeline to merge data from many sources, handle missing values, and produce a reproducible dashboard. A finance team forecasting quarterly revenue may rely on Python for modeling and sensitivity analysis, while the finance analyst updates inputs in Excel for rapid scenario planning. These case studies illustrate that the optimal choice is not the tool itself but the task at hand, the stakeholders involved, and the required reproducibility and auditability.
Strategies for a blended workflow: bridging Excel and Python
A practical blended workflow starts with data in Excel or CSV, followed by a Python step that handles heavy lifting. You can implement a two-way bridge using libraries like openpyxl or pyxlsb to read/write Excel files or by exporting from Python to Excel-ready formats. Standardize data dictionaries, units, and date formats to avoid inconsistency across environments. Use notebooks for exploration and a version-controlled script for production. Schedule automated runs with a scheduler or CI/CD pipeline where appropriate. Finally, invest in training so that analysts can fluently switch between environments, ensuring continuity and collaboration. The blended approach leverages the strengths of both worlds without locking teams into a single workflow.
Future-proofing your data analysis stack
The data landscape continues to evolve, with new tools that push beyond traditional Excel and Python into areas like low-code platforms and automated ML. To future-proof, focus on portability, interoperability, and governance. Emphasize moving beyond siloed spreadsheets by adopting modular data pipelines, centralized data dictionaries, and clear handoffs between discovery, prototyping, and production. Maintain documentation, library versions, and data lineage to support audits and change management. Finally, invest in ongoing training and peer learning so that your team remains adept at evaluating new options and rebalancing tooling as needs shift. The XLS Library perspective emphasizes that a balanced stack—leveraging Excel for fast insights and Python for scalable analytics—offers resilient adaptability in a changing data world.
Comparison
| Feature | Excel | Python (pandas) |
|---|---|---|
| Data size & performance | Strong for small to medium datasets; performance depends on workbook design | Handles large datasets with libraries like pandas; performance scales with hardware and code quality |
| Learning curve | Low for basic tasks; quick to start | Steeper; requires programming concepts and debugging skills |
| Automation & reproducibility | Limited without scripting; manual steps are common | High; scripts are modular, testable, and version-controlled |
| Ecosystem & libraries | Extensive add-ins, built-in functions, and BI-compatible features | Rich ecosystem: pandas, NumPy, SciPy, scikit-learn, visualization libraries |
| Best for | Lightweight, fast exploration and stakeholder-ready dashboards | Data science, automation, complex modeling, and scalable pipelines |
| Cost & licensing | Often bundled with Office subscriptions | Python is open-source; total cost depends on environment setup and support |
Benefits
- Excel enables rapid ad-hoc analysis with immediate visual feedback
- Python enables reproducible pipelines and scalable analytics
- Both ecosystems offer strong community support and resources
- Hybrid workflows can leverage strengths of both tools
What's Bad
- Excel can drift with large, complex workbooks and lacks robust automation
- Python requires programming knowledge and environment setup
- Maintaining cross-tool data integrity requires discipline and governance
Python is typically the better long-term choice for scalable data analysis; Excel is best for quick, collaborative, spreadsheet-driven work
Choose Python when you need automation, reproducibility, and handling larger, evolving datasets. Choose Excel for fast exploration and presenting data to stakeholders; use a blended approach to cover both needs.
People Also Ask
Can Excel handle big data analytics?
Excel can manage moderately large datasets, especially with data models and Power Pivot, but practical limits exist. For very large or streaming datasets, Python or dedicated BI/betware is typically more robust.
Excel works for moderate data; for very large datasets, consider Python or BI tools.
Is Python mandatory for data analysis?
No. You can perform many analyses in Excel, especially for quick prototyping and sharing results. Python becomes advantageous as data size, complexity, and automation needs grow.
You don't have to use Python, but it's powerful for scaling up.
Can I blend Excel and Python in a workflow?
Yes. A common pattern is to prototype in Excel and transfer the logic to Python for automation, or to export data from Python into Excel-ready formats for distribution.
Yes—you can bridge Excel and Python for a smoother workflow.
Which tool is better for visualization?
Excel offers quick, accessible charts ideal for dashboards. Python supports advanced visuals via libraries like matplotlib and seaborn, useful for publication-quality graphics.
Excel is great for quick visuals; Python excels in advanced charts.
What about cost and licensing?
Excel typically requires an Office subscription, while Python is free to use. Total cost depends on licenses, IT policies, and the need for IT support or training.
Excel costs depend on Office licensing; Python is free, with potential training costs.
The Essentials
- Identify the task: quick exploration vs scalable analysis
- Choose Python for automation and large datasets
- Use Excel for fast, stakeholder-facing insights
- Adopt a blended workflow to maximize both tools
- Establish governance and data dictionaries from the start