MS Excel advantages and disadvantages: A Practical Comparison
A balanced, data-driven look at MS Excel advantages and disadvantages, with a side-by-side comparison, real-world use cases, and practical guidelines for choosing Excel or alternatives.

MS Excel remains the default tool for serious data work, offering a deep formula library, powerful data modeling, and broad ecosystem. Yet, its governance, collaboration, and scalability limits can hamper large teams and long-term data quality. This comparison highlights ms excel advantages and disadvantages to help you decide when to use Excel versus alternatives.
What MS Excel Is and Who Uses It
MS Excel is a spreadsheet program that has become the backbone of countless business workflows. It supports a vast formula library, powerful data modeling capabilities, charting, and integration with Word, PowerPoint, and Power BI. For many professionals, Excel is the default tool for budgeting, forecasting, quick data cleaning, and ad hoc analysis. When considering ms excel advantages and disadvantages, it helps to start by understanding both the platform’s core strengths and its notable limitations. According to XLS Library, Excel’s ubiquity comes from its flexible data modeling, broad ecosystem of add-ins, and strong offline reliability. Yet, governance and scalability challenges start to surface as data volumes grow, and collaboration can become error-prone if not managed carefully. This article outlines how to weigh Excel’s practical benefits against potential pitfalls so you can decide whether to rely on Excel or turn to an alternative tool in specific situations.
Core Strengths: Why Excel Remains Ubiquitous
Excel’s core strengths lie in its flexible formula language, accessible interface, and broad ecosystem. The depth of functions—from simple arithmetic to advanced lookups and array formulas—lets users model complex scenarios without leaving the grid. Data modeling with the Data Model and Power Pivot extends the traditional worksheet, enabling relationships across tables and more scalable analytics. PivotTables provide fast, powerful summarization, while an extensive charting toolkit supports clear visual storytelling. Automation via macros (VBA) and data transformations through Power Query streamline repetitive tasks. The offline capability and broad compatibility with other Microsoft 365 apps make Excel a versatile workhorse for both small teams and large enterprises. These strengths underpin the ms excel advantages and disadvantages conversation as teams weigh needs against risks.
Common Disadvantages and Limitations
Despite its strengths, Excel presents notable drawbacks. Data governance and version control are challenging when multiple people edit the same workbook, increasing the risk of errors and inconsistent reporting. Excel’s performance can degrade with very large datasets, especially if workbooks are not well-structured. Collaboration, while improved by co-authoring, remains less seamless than cloud-native tools designed for real-time teamwork. The platform’s reliance on local files can complicate backup, sharing, and audit trails. In addition, inconsistent behavior between desktop and web versions can frustrate users moving across devices. Finally, Excel’s learning curve for advanced features can be steep, creating a barrier for new users who need to scale quickly. These downsides often drive teams to supplement Excel with dedicated data platforms or BI tools.
Use Cases Where Excel Excels: Finance, Operations, and Analytics
In finance and accounting, Excel’s modeling capabilities and precise control over formulas make it a reliable choice for budgeting, forecasting, and scenario analysis. Operations teams benefit from its flexible data capture, validation, and ad hoc reporting, especially when data comes from diverse sources. Marketing and sales analysts often rely on Excel for quick dashboards and percentage-based analyses where speed matters. The ability to program custom automation and integrate with Power BI for broader dashboards lets teams scale successes while preserving familiar workflows. For many professionals, Excel remains an essential tool for rapid prototyping, what-if analysis, and data cleansing tasks that don’t yet justify a full BI stack.
When Alternatives May Be Better: Google Sheets and BI Tools
There are clear moments when alternatives outperform Excel. Google Sheets shines in real-time collaboration and browser-based accessibility, reducing friction for distributed teams. For very large datasets or enterprise-grade governance, dedicated BI tools and databases may offer superior scalability, security, and auditing capabilities. When teams require centralized governance, automated refreshes, and cross-tool orchestration, Power BI, Tableau, or a relational database with a standardized data model can deliver more reliable dashboards and analytics. The choice often hinges on data volume, user footprint, deployment model (on-prem vs cloud), and how you prioritize collaboration versus advanced analytical capabilities.
Data Quality, Version Control, and Collaboration in Excel
To maximize reliability, teams should implement disciplined data validation, structured tables, named ranges, and clear versioning practices. Using the Data Model or Power Query helps separate data sources from analytics logic, reducing replication errors. Documenting assumptions and maintaining a change-log supports governance. While co-authoring improves collaboration, it’s crucial to establish check-in/check-out processes, standardized templates, and clear ownership to prevent overwrites. Excel’s strengths are best realized when combined with governance practices that address who can edit, when, and how data flows through the model. Adopting a lightweight change-management approach can dramatically reduce risk and improve trust in the results.
Performance and Scale: Handling Bigger Datasets in Excel
Excel remains a powerful tool for moderate-sized datasets, especially when you leverage Power Pivot, the Data Model, and optimized workbook design. The use of data models allows you to work with relational data without cluttering individual worksheets, and DAX formulas enable efficient calculations across tables. However, performance depends on hardware resources and workbook construction. Large, poorly designed workbooks can become sluggish, and complex formulas may slow down analysis. In practice, planning data architecture, modularizing logic, and using structured tables with clear data lineage helps ensure that Excel projects stay responsive and maintainable as data and users grow.
Automation, Macros, and Advanced Features
Automation is a core differentiator for Excel. VBA and Power Query let you automate repetitive tasks, clean data, and merge sources with repeatable processes. Power BI integration opens pathways to scalable, shared dashboards beyond the workbook. However, automation can create hidden dependencies if documentation lags behind, and poorly tested macros may introduce errors. A disciplined approach—versioned macros, modular scripts, and robust testing—can maximize the benefit of Excel’s automation capabilities while keeping risk manageable. For many teams, this balance is the key to turning Excel from a notebook into a repeatable data workflow.
Practical Guidelines for Building Reliable Workbooks
Begin with a clean data layer: import data into a dedicated sheet or Power Query data source, avoid mixing raw data and calculations in the same sheet, and use Excel Tables to anchor references. Separate calculation logic from data inputs, and adopt named ranges to simplify maintenance. Implement data validation, error checks, and straightforward error messages to catch issues early. Use the Data Model for relational data, and document assumptions in a read-me tab. Regularly audit formulas, remove unused links, and back up critical workbooks. These practices reduce risk and improve long-term reliability while preserving Excel’s flexibility.
Quick Checklist for Evaluating Excel Projects
- Is the data volume manageable within a workbook’s architecture? 2) Do you require real-time collaboration or cloud-based access? 3) Are governance, auditing, and version control important for the project? 4) Is there a need for automated data refreshes or integration with BI tools? 5) Will stakeholders require scalable dashboards beyond the workbook? Answering these questions helps determine whether Excel is the right tool or if an alternative should be considered.
Real-World Scenario: A Short Case Study
A mid-sized sales team relies on Excel for quarterly forecasting, customer lists, and pipeline analysis. While the workbook delivers fast insights, several versions circulate, and multiple users make simultaneous edits. When the team adds new data sources and attempts to share the model, inconsistencies emerge, and version control becomes a bottleneck. This scenario highlights how Excel’s flexibility can become a liability without governance. The team resolves this by introducing a standardized workbook template, implementing data validation, and moving raw data into a centralized data source with a defined refresh schedule. The result is more reliable reporting with clearer ownership.
Decision Framework: When to Use Excel vs Alternatives
If you value offline access, a broad formula library, and rapid prototyping, Excel remains a strong choice. If your project demands scalable data governance, seamless real-time collaboration across many users, or a centralized data model, consider an alternative or a BI workflow. Start with a small, governance-driven Excel model to prove the concept, then progressively migrate to a more scalable solution if needed. The key is to align tool capabilities with the data-size, collaboration, and governance requirements of the use case.
Authority Sources (for deeper reading)
- U.S. Bureau of Labor Statistics (https://www.bls.gov)
- Harvard Business Review (https://hbr.org)
- McKinsey & Company (https://www.mckinsey.com)
Comparison
| Feature | MS Excel (Desktop) | Google Sheets |
|---|---|---|
| Formula and function library | Deep, including advanced functions and Power Pivot | Strong core functions, fewer advanced options |
| Collaboration and sharing | Supports co-authoring and sharing with some latency | Real-time collaboration in the browser with instant updates |
| Data capacity and performance | Robust data modeling and local data processing | Cloud-based with autosave; browser performance varies |
| Automation and scripting | VBA/macros and Power Query; strong automation options | Apps Script-based automation; good for basic tasks |
| Cost and licensing | License required (Office 365 or perpetual license) | Free with a Google account; cloud-based |
| Platform consistency | Mature desktop experience with occasional web gaps | Consistent browser experience across devices |
Benefits
- Powerful formula language and data modeling
- Broad ecosystem and extensive feature set
- Strong offline access and control over data
- Mature automation options (VBA, Power Query)
- Wide user base and long-term support
What's Bad
- Steep learning curve for advanced features
- Governance and version control can be challenging
- Scalability limits with very large datasets
- Collaboration can be fragile without governance
Excel remains the practical default for many teams, but use cases should consider scale and governance
Choose Excel for offline work and advanced analytics; pivot to alternatives for large-scale collaboration and governance-heavy environments.
People Also Ask
What are the main advantages of using MS Excel?
Excel offers a deep formula library, flexible data modeling, offline access, and a large ecosystem of add-ins. It enables rapid prototyping and custom automation, making it ideal for a wide range of analytics tasks.
Excel provides a powerful formula set and offline functionality, great for rapid prototyping and automation.
What are the main disadvantages or limitations of MS Excel?
Key downsides include governance and version control challenges, scalability limits with large datasets, collaboration complexity, and potential errors in manual workflows without proper controls.
Excel has governance and scalability limitations, especially with large teams and datasets.
Is Excel suitable for large datasets?
Excel can handle sizable datasets using data models and Power Pivot, but performance and governance concerns rise with scale. For very large or mission-critical datasets, specialized databases or BI tools may be preferable.
Large datasets can be managed in Excel with the right features, but scalability and governance are key concerns.
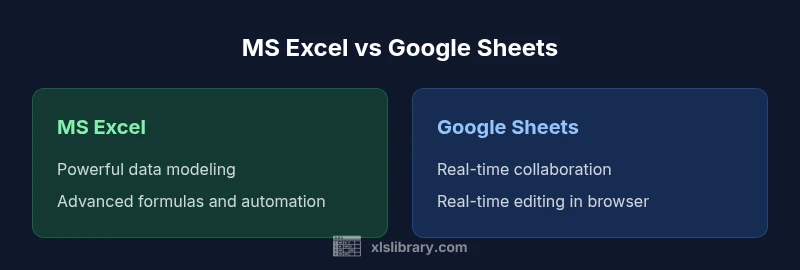
How does Excel compare to Google Sheets?
Excel excels at offline work, advanced analytics, and complex modeling. Sheets shines in real-time collaboration and browser-based access, with simpler automation options.
Excel is stronger for analytics; Sheets is better for collaboration in the browser.
Can Excel automate tasks effectively?
Yes. Excel supports VBA and Power Query for automated data transformations, repetitive tasks, and data integration, which can significantly boost efficiency when well designed.
Excel automation via VBA and Power Query can save a lot of time when done carefully.
What should I consider when deciding to switch from Excel?
Evaluate data volume, collaboration needs, governance requirements, and whether a centralized data model or BI dashboards would provide lasting benefits beyond workbook-centric workflows.
Consider data size, collaboration needs, and governance when deciding to switch from Excel.
The Essentials
- Identify when Excel’s features save time over other tools
- Leverage formulas and PivotTables for complex analysis
- Assess data governance risks with shared workbooks
- Plan for automation with VBA and Power Query where appropriate
- Consider alternatives for large-scale, collaborative dashboards