Budget Personal Excel: A Practical Budget Guide
Learn to build a budget personal excel workbook to track income, expenses, and goals. Practical steps, formulas, and dashboards from XLS Library help you stay financially organized and scalable.

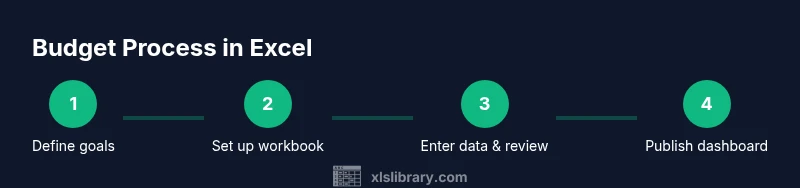
You will learn how to build a personal budget in Excel from scratch, including setting goals, organizing income and expenses, creating a simple balance, and designing a basic dashboard. You’ll also find practical tips to keep the workbook up to date and scalable for future months. This quick guide outlines the core steps.
Overview: Budget Personal Excel
A budget personal excel workbook is a dedicated file that captures all income streams, fixed and variable expenses, and savings goals in one place. This guide focuses on making a practical, repeatable setup you can reuse month after month. By the end, you’ll have a structured template you can expand with dashboards and insights. According to XLS Library, starting with a clear scope and consistent categories dramatically improves budgeting outcomes and long-term financial clarity.
Why budget planning matters
A well-constructed budget in Excel helps you see where money goes and where you can cut back. It promotes accountability by linking spending to your goals, whether that’s paying off debt, building an emergency fund, or saving for a big purchase. A budget also creates a baseline so you can measure progress over time. The XLS Library team emphasizes that a disciplined approach to budgeting reduces anxiety and increases confidence in financial decisions.
Core budgeting principles for Excel
Begin with a simple structure: separate sheets for Income, Expenses, and a Summary. Use consistent categories (e.g., Salary, Side Income, Rent, Utilities, Groceries, Transportation, Entertainment, Savings) and align them with your goals. Always anchor with a starting balance and forecast monthly income. Use a dashboard to visualize key metrics like net cash flow and savings rate. These habits lay a solid foundation for year-over-year improvements, as highlighted by XLS Library’s practical budgeting guidelines.
Setting up your workbook structure in Excel
Create a clean workbook with tabs for: 1) Income, 2) Expenses, 3) Categories, 4) Monthly Budgets, 5) Dashboard. Use named ranges for critical data (e.g., incomeTotal, expensesTotal) to simplify formulas. Decide on the monthly layout (one tab per month or a rolling month approach). Maintain a ‘Beginning Balance’ and a ‘Net’ row to track the delta between income and expenses. Consistency here makes future months a breeze.
Data structure: categories and accounts
Develop a consistent chart of accounts tailored to your life. Break down large categories (Housing, Transportation, Food) into subcategories as needed (Rent, Insurance, Fuel, Groceries). Use a dedicated Categories sheet to map each subcategory to a broader category. This mapping supports scalable analysis and clean dashboards. Keep your list in a table so you can add entries without breaking formulas.
Core formulas you’ll rely on
Lean on SUM for totals, SUMIF or SUMIFS for category totals, and AVERAGE or MEDIAN for trend analysis. Use IF and conditional formatting to flag overspending or goals that are at risk. For dashboards, create simple aggregations like Net Income (Total Income - Total Expenses), Savings Rate (Savings / Income), and category-by-month comparisons. Practice with sample values to validate your formulas before entering real data.
Building a monthly budget: practical steps
Start with a baseline month: input expected income and fixed expenses, then forecast variable expenses. Compare actuals at month-end and adjust next month. Add a buffer for unexpected costs and consider seasonal variations. Use data validation to constrain entries to valid categories, which reduces errors and makes analysis consistent across months. Keep your template lean and scalable.
Visualizing with a dashboard: quick wins
A dashboard should show the most important numbers at a glance: net income, total expenses by category, and progress toward goals. Use charts sparingly—bar charts for category comparisons, line charts for trend, and a donut chart for expense mix. Keep color coding intuitive: green for under-budget, red for over-budget. A well-designed dashboard makes it obvious where attention is needed.
Practical examples and scenarios
Try two common scenarios: 1) a steady monthly income with recurring expenses, and 2) variable income with fluctuating expenses. In scenario 2, highlight how the dashboard flags months when actuals deviate from plan and suggest adjustments. Realistic scenarios help you anticipate cash flow issues and build resilience into your budgeting process.
Common pitfalls and how to avoid them
Avoid wrapping every expense into a single “Misc” category; break expenses down for clarity. Don’t hard-code values across months—use references and named ranges. Regularly back up your workbook and test formulas with synthetic data before trusting your numbers. Keep the workbook updated weekly to catch drift early.
Advanced tips for power users
Leverage Power Query to import bank transactions, use VLOOKUP/XLOOKUP to map categories, and implement dynamic charts that respond to filters. Consider a separate debt-tracking sheet with amortization schedules and a separate savings goals tracker. If you’re comfortable with macros, automate monthly refresh tasks and summary generation to save time.
Maintaining and growing your budgeting skills with Excel
Commit to a monthly review ritual: update data, re-check formulas, and refine categories as life changes. As you become more confident, expand your workbook to include dashboards, scenario planning, and goal-tracking. The goal is a living budget that evolves with your financial situation, not a static worksheet. According to XLS Library, practice with a consistent framework yields lasting budgeting gains.
Tools & Materials
- Microsoft Excel (Office 365 or equivalent)(64-bit recommended; supports modern functions)
- Computer or laptop(With internet access and at least 4GB RAM)
- Budget categories list (CSV or Excel-ready)(Categories like Income, Housing, Food, Transport, Savings)
- Prebuilt budget template (optional)(If starting from scratch, you can download a starter workbook)
- Printer (optional)(Print monthly statements if you prefer paper)
Steps
Estimated time: 60-90 minutes
- 1
Define your budgeting goals
Identify what you want to achieve with your budget (debt payoff, emergency fund, big purchase) and set monthly targets. Write clear, measurable goals to guide your spending decisions.
Tip: Use SMART criteria for each goal to improve clarity. - 2
Set up workbook structure
Create sheets for Income, Expenses, Categories, Monthly Budgets, and Dashboard. Establish a consistent naming convention and file structure to keep it scalable.
Tip: Link sheets with named ranges for easier maintenance. - 3
List all income sources
Document every income stream (salary, freelance work, gifts) with expected monthly amounts. Include variability if applicable to improve realism.
Tip: Separate primary and secondary income for clearer analysis. - 4
Define expense categories
Create a comprehensive chart of accounts and subcategories as needed. Map each subcategory to a broader category for cleaner dashboards.
Tip: Avoid vague buckets; detailed categories improve insight. - 5
Enter starting balances
Input current balances to anchor your budget. This baseline ensures calculations reflect real financial position from day one.
Tip: Cross-check with recent bank statements for accuracy. - 6
Set up totals formulas
Use SUM for overall totals and SUMIFS for category-specific totals. Validate that totals propagate correctly across months.
Tip: Test formulas with sample numbers before live data. - 7
Create a monthly baseline
Draft an initial month showing expected income and expenses. Establish a baseline you can refine over time.
Tip: Include a 5-10% contingency buffer for surprises. - 8
Design a dashboard
Add visuals: net income, spending by category, and progress toward goals. Keep visuals simple and readable to drive quick decisions.
Tip: Use a single KPI card to summarize core performance. - 9
Link data across sheets
Reference cells across sheets so that changes in one place update all totals automatically.
Tip: Avoid hard-coded numbers; prefer dynamic references. - 10
Set up data validation
Create drop-down lists for categories to minimize entry errors and maintain consistency.
Tip: Lock cells that contain formulas to prevent accidental edits. - 11
Test with a sample month
Enter hypothetical data to verify that calculations and dashboards respond correctly.
Tip: If you spot errors, revert to a backup and fix the source problem. - 12
Review and refine monthly
At month-end, compare actuals to plan, adjust forecasts, and save a new monthly sheet for historical tracking.
Tip: Document learnings to inform next month’s budget.
People Also Ask
What is a personal budget in Excel?
A personal budget in Excel is a file that tracks income, expenses, and goals using Excel features like formulas and charts. It helps you see cash flow and make informed decisions.
A personal budget in Excel is a tracked plan for your money, using sheets, formulas, and visuals.
Which Excel features are best for budgeting?
Key features include SUM, SUMIF/S, XLOOKUP, conditional formatting, and charts. They help totals, category analysis, and visual insights.
Use sums, lookups, and charts to organize and visualize your budget.
How do I start if I’m new to Excel?
Begin with a simple template, learn basic formulas like SUM and AVERAGE, then gradually add dashboards and validations as you grow more comfortable.
Start with a simple template and basic formulas, then expand as you learn.
Can I use Google Sheets for budgeting?
Yes. Budgeting concepts transfer to Google Sheets, though some formulas or features may differ slightly. Keep the structure consistent when migrating.
Yes, you can use Google Sheets, with minor formula adjustments.
How should I handle debt in a budget?
Add a Debt category, track payments, and model interest where applicable. Consider separate debt payoff goals for clarity.
Include debt tracking and payoff goals to stay focused.
How often should I update my budget?
Weekly updates provide the most accurate picture, with a bigger monthly review to adjust goals and forecasts.
Update regularly, ideally every week.
Watch Video
The Essentials
- Define clear budgeting goals and track monthly progress.
- Keep a consistent workbook structure for scalability.
- Use formulas and dashboards to visualize spending patterns.
- Review monthly to improve accuracy and outcomes.