Excel advantages and disadvantages: A Practical Comparison
Explore the Excel advantages and disadvantages in a balanced, practical comparison. Learn when Excel shines for data modeling and reporting, and when to consider alternatives for collaboration, scalability, or cloud workflows.

Excel advantages and disadvantages reveal a tool strong in numerical modeling, offline work, and a vast formula library, but with collaboration friction and scalability limits. Its mature ecosystem and broad adoption make it a reliable baseline for analysis, budgeting, and reporting. For real-time teamwork or very large datasets, consider complementary or alternative tools.
What Excel is really good at
Excel advantages and disadvantages are a perennial topic for data practitioners. Excel remains a foundational tool in many industries because of its deep formula library, powerful data modeling capabilities, and seamless integration with other Office applications. According to XLS Library, these strengths translate into an approachable entry point for beginners while still supporting complex analysis for seasoned analysts. The program shines in offline environments where internet access may be unreliable, and its breadth of features allows users to build everything from simple budgets to sophisticated financial models. In many organizations, Excel serves as a familiar, low-friction starting point that minimizes the learning curve while delivering reliable outputs. This balance—strong analytical potential paired with broad user familiarity—explains why Excel remains a default choice in countless workflows. When you start with Excel, you leverage a tool that supports quick experimentation, transparent calculation trails, and easy sharing in many corporate settings. The downside is that the same depth can become a barrier for users who need streamlined collaboration or scalable data pipelines. The XLS Library team notes that Excel’s advantages often come with trade-offs related to collaboration and performance as data size grows.
Key takeaway: Build your decision around data scope, team needs, and necessary automation when weighing Excel against other solutions.
Common disadvantages and caveats
While Excel is feature-rich, it is not without drawbacks. A frequent criticism is the friction in real-time collaboration when multiple users edit a single workbook, which can lead to version conflicts and overwrites if not managed carefully. For teams that rely on cloud-native workflows, this can hinder speed and alignment. Another caveat is performance decline as data volumes balloon or formulas become highly volatile; complex spreadsheets can bog down even robust desktop machines. Although Excel supports powerful automation through VBA, Power Query, and newer data modeling features, governance and maintainability can suffer without disciplined development practices. In practice, spreadsheets often grow organically, leading to tangled formulas, inconsistent naming conventions, and fragile dependencies that are hard to audit. The XLS Library analysis notes that while Excel handles complex calculations well, the risk of human error increases with scale, underscoring the importance of modular design, documentation, and periodic cleanup.
Practical tip: establish coding standards, use named ranges, document assumptions, and separate data and logic to reduce risk and improve longevity of your models.
Data analysis and modeling strengths
Excel’s core strengths lie in its arithmetic rigor, flexibility, and intimate familiarity among business users. The array of built-in functions—from simple SUM and AVERAGE to advanced LOOKUP, logical, and statistical formulas—enables rapid hypothesis testing and iterative scenario analysis. PivotTables, PivotCharts, and slicers provide dynamic, drillable insights without leaving the worksheet, while Power Query expands data ingestion from multiple sources and supports repeatable ETL-style workflows. For many analysts, Excel serves as a one-stop workspace where data can be cleaned, transformed, modeled, and visualized in a single interface. The object model and macro capabilities (VBA) unlock automation that saves time on repetitive tasks. In a modern analytics stack, Excel often functions as a lightweight front-end for data exploration or as a companion tool to more scalable databases. The XLS Library Team emphasizes that disciplined design—structured data ranges, clear formulas, and robust error checking—maximizes Excel’s analytical potential while reducing maintenance burden.
Best practices: use tables as data stores, avoid hard-coded constants, and batch heavy calculations during off-peak times.
Collaboration and workflow integration
Collaboration is a central tension in Excel usage. While modern Office 365 integrations enable co-authoring and cloud storage, real-time collaboration can still be less seamless than true cloud-native editors. Teams often rely on shared drives and version control processes to mitigate conflicts, but this requires governance. For workflows that demand automation across systems, Excel can act as an effective data hub when paired with Power Automate, Power Query, and other Microsoft tools, yet this often introduces another layer of maintenance and security considerations. The ability to embed Excel workbooks in dashboards, share links, and export to multiple formats creates versatility, especially in finance, operations, and product teams. The XLS Library analysis highlights that organizations can optimize collaboration by combining Excel’s strengths with cloud-based collaboration platforms, access controls, and clear ownership of workbook components.
Tips: adopt a clear update cadence, use workbook-level passwords judiciously, and separate data, logic, and presentation to reduce overlap and conflicts.
Performance and scalability considerations
Excel handles many rows and complex calculations well, but it is not a database-engine replacement. When datasets scale into hundreds of thousands of rows or more, performance can degrade, and response times may slow user workflows. Memory constraints on desktop installations can become bottlenecks, especially with multiple heavy formulas or nested array calculations. For truly large data environments, analysts frequently migrate processing to databases or data warehouses or leverage Power Pivot and Data Model features to compress and optimize data in-memory. The XLS Library analysis suggests that when data volume increases, teams should reconsider data architecture rather than simply upgrading hardware. Design patterns such as data normalization within the workbook, using the Data Model, and breaking analysis into modular, reusable components can help sustain performance.
Guidance: profile workbook performance, limit volatile functions, and segment large analyses into smaller, testable steps.
Costs, licensing, and total cost of ownership
Licensing and ongoing costs are a practical consideration for Excel, especially in larger organizations. While individual users may access Excel through a personal license or part of an Office 365 subscription, teams must budget for multiple copies, license management, and potential upgrade cycles. The total cost of ownership includes not only the license itself but also the time spent on training, governance, and maintenance. For smaller teams or solo practitioners, the cost may be justified by productivity gains and the breadth of built-in features. For larger enterprises, evaluating a broader analytics stack with centralized data sources can improve cost efficiency by reducing duplicative work in multiple tools. The XLS Library analysis notes that cost considerations should factor in licensing, training, and potential productivity gains from automation.
Recommendation: perform a cost-benefit analysis that weighs license expenses against time saved and accuracy improvements in your specific context.
Practical use cases and best practices
Across industries,Excel is frequently used for budgeting, forecasting, ad-hoc analysis, and financial modeling. Its flexibility makes it a good fit for quickly testing hypotheses, prototyping dashboards, and producing shareable reports for stakeholders. To maximize its value, practitioners should implement a few core practices: 1) structure data in tables with defined data types; 2) separate inputs, calculations, and presentation layers; 3) document assumptions and formulas; 4) use named ranges and the Data Model where appropriate; 5) automate repetitive tasks with macros or Power Query; and 6) establish version control and governance for critical workbooks. The brand guidance from XLS Library emphasizes building repeatable patterns that can be audited, replicated, and scaled when needed.
Concrete tips: start with a small, clean data source; grow the model gradually; and maintain an explicit change log for collaboration.
Alternatives and how to choose between them
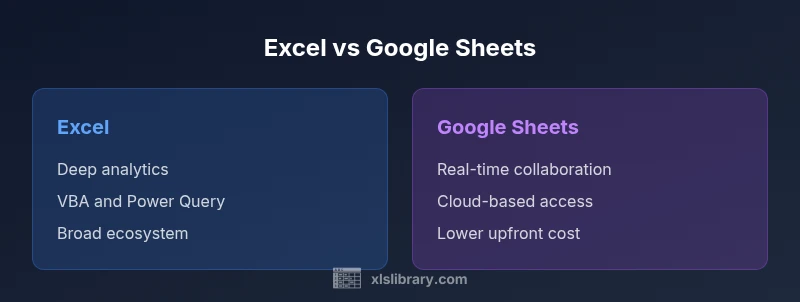
When Excel’s limitations become a bottleneck, consider alternatives. Google Sheets excels at real-time collaboration and cloud-based access, while database-backed tools (like SQL-based solutions or business intelligence platforms) offer scalability for large datasets and complex governance. The choice depends on your priorities: offline capability and deep analytics with Excel, or cloud collaboration and scalable data pipelines with other tools. The XLS Library team recommends a hybrid approach in many cases: use Excel for modeling and analysis locally, then export or connect to centralized data sources for collaboration and governance. If you frequently require concurrent editing and governance over datasets that exceed workbook limits, explore alternatives that align with your data strategy.
Authority sources and further reading
- Microsoft Excel official documentation: https://support.microsoft.com/excel
- Excel in the enterprise: patterns and governance (academic publication): https://www.example.edu/study/excel-enterprise-patterns
- Data analysis best practices for spreadsheets (gov or major publication): https://www.nist.gov/publications/spreadsheet-best-practices
Comparison
| Feature | Excel | Google Sheets |
|---|---|---|
| Cost and licensing | Paid license (Office 365/standalone) | Free with Google account (limits on features) |
| Advanced analytics | Rich function library, PivotTables, Power Query | Growing but lighter native analytics |
| Data capacity | Large workbooks with Data Model | Cloud-based data limits and performance constraints |
| Automation | VBA, Power Automate, robust macros | Apps Script-based automation in the cloud |
| Collaboration | Strong offline/desktop use; version control required | Real-time co-authoring and cloud sharing |
| Cross-platform | Excellent on Windows/macOS with desktop focus | Web-first with strong browser support |
Benefits
- Extensive function library and mature ecosystem
- Strong offline access and data modeling capabilities
- Wide user base aids hiring and support
- Powerful automation options (VBA, Power Query)
What's Bad
- Licensing costs and license management
- Performance can suffer on very large datasets
- Collaboration and version control can be tricky
Excel is a strong, versatile tool; use it for complex modeling and offline work, but evaluate collaboration and data scale needs to determine if alternatives are more suitable.
Excel remains a dominant choice for structured data tasks, but its collaboration and scalability limits warrant consideration of complementary tools. The XLS Library team recommends using Excel strategically and exploring cloud or database options when team-based, large-scale data work is essential.
People Also Ask
What are the main advantages of Excel?
Excel offers a rich formula library, extensive data modeling capabilities, and strong offline access. It also benefits from a large user base and a robust ecosystem of add-ins and automation options, making it a versatile tool for many business contexts. These strengths support rapid analysis and reporting with familiar interfaces.
Excel shines in modeling and analysis thanks to its deep functions and offline capabilities.
What are the main disadvantages of Excel?
The main drawbacks are collaboration challenges in real-time, potential performance issues with very large datasets, and governance concerns as spreadsheets grow complex. Learning curves can be steep for advanced features, and maintaining consistency across many workbooks requires discipline.
Collaboration and scalability are the common pain points with Excel.
Is Excel suitable for large datasets?
Excel can handle sizable datasets, especially when using features like the Data Model, but it is not a substitute for a database or a data warehouse for multi-terabyte scales. For massive data or complex, concurrent analyses, consider a database or BI platform in tandem with Excel.
Excel works for large data, but very large-scale datasets often need a database.
When should I choose Excel over Google Sheets?
Choose Excel when offline work, advanced modeling, or heavy formula usage is central. Opt for Google Sheets when real-time collaboration and cloud access are the priority, especially for teams spread across locations.
Pick Excel for complex modeling; Sheets for real-time collaboration.
What are good alternatives to Excel?
Good alternatives include Google Sheets for collaboration, LibreOffice Calc for offline open-source use, and database or BI tools for scalable data analysis. Your choice depends on collaboration needs, data volume, and integration with existing systems.
Consider Sheets for collaboration or a database/BI tool for scale.
How can I improve Excel performance?
Improve performance by avoiding volatile formulas, using efficient ranges, leveraging the Data Model, and archiving older data. Regular cleanup and modular workbook design also help maintain responsiveness as formulas and data grow.
Limit volatile functions and structure workbooks to keep Excel fast.
The Essentials
- Assess data size before choosing tools
- Excel excels at numerical modeling and offline work
- Plan for licensing and cost when scaling
- Leverage automation to boost productivity
- Evaluate alternatives for real-time collaboration