Comparison Excel Sheet Template: Make Better Decisions with Data
Practical guide to building and using a comparison excel sheet template that standardizes criteria, weights, and scoring for clear, data-driven decisions, with practical examples.

A well-designed comparison excel sheet template standardizes how you evaluate options, capture criteria, assign weights, and score each choice. It helps teams see trade-offs at a glance, reduces bias, and speeds up decision making. By detailing criteria, scoring scales, data sources, and a final verdict, the template turns complex judgments into a repeatable, auditable process. According to XLS Library, clarity and consistency are the keystones of reliable comparisons.
What is a comparison excel sheet template?
A comparison excel sheet template is a structured workbook designed to help you evaluate several options across a common set of criteria. It combines a clear list of options with a scoring system, weights for criteria, and a final synthesis that highlights strengths, weaknesses, and trade-offs. When used consistently, it reduces bias and makes complex decisions auditable. According to XLS Library, the most effective templates separate data collection from interpretation, so teams can see how conclusions were reached. In practice, you start by defining the decision objective, list the viable options, and declare the criteria you care about. Then you assign a scoring scale (for example 1-5) and weights that reflect importance. The template automatically aggregates scores and presents a visual conclusion, often with a sensitivity analysis to show how results change if weights shift. This approach supports both quick, high-level choices and deep, data-driven evaluations.
Core design principles for an effective template
An effective comparison excel sheet template follows core design principles to ensure reliability, scalability, and ease of use. First, keep the structure modular: separate inputs (options, criteria, weights) from calculations and outputs (scoring, charts, and summaries). Second, prioritize clarity and readability with clean layouts, consistent fonts, and unambiguous labels. Third, use neutral, defensible weighting: document why each weight matters and avoid hard-coding assumptions that bias outcomes. Fourth, enforce data validation and controlled vocabularies to reduce input errors. Fifth, plan for evolution: use versioning, documentation, and an auditable trail so stakeholders can trace how a decision was made. When you align with these principles, your template remains useful across projects and teams. The XLS Library team emphasizes that a well-structured template reduces cognitive load and supports transparent, data-driven discussions.
Essential components to include in the template
A strong comparison excel sheet template contains several essential components that work together to produce credible results. Start with a brief decision objective at the top. Next, list the options side by side, so readers can compare apples to apples. Then define criteria, including both quantitative and qualitative measures. For each criterion, include a scoring scale (e.g., 1 to 5) and a weight that reflects its importance. Add a summary area that aggregates scores and displays a verdict or recommendation. Include a sensitivity analysis section that shows how results shift when weights change. Finally, document data sources, date stamps, and any assumptions to support auditability. When these parts are present, the template becomes a practical tool rather than a static checklist.
How to assign weights and score consistently
Weighting is the most delicate part of a comparison template. Start by agreeing on a clear set of criteria and a shared interpretation of the scoring scale. Many teams use a tiered approach (e.g., 1 = poor, 3 = good, 5 = excellent) and assign weights on a scale of 0 to 1, ensuring the sum of weights equals 1. For consistency, consider using baseline weights for common decision types and then adjust for the specific context. Use documented rationales for each weight so others can audit the rationale. When possible, use neutral data sources, and separate subjective judgments from objective data. A common technique is to compute a weighted score for each option by multiplying its criterion score by the criterion weight and summing across all criteria. Finally, include a simple sensitivity analysis that shows how results change if prominent weights drift.
Step-by-step guide to building your template (practical, repeatable)
Follow these steps to build a robust template from scratch: 1) Define the decision objective and the horizon. 2) List the options under consideration. 3) Identify the evaluation criteria and categorize them (quantitative vs qualitative). 4) Choose a scoring scale and document the interpretation. 5) Assign weights to each criterion based on importance. 6) Create the calculation area that aggregates scores for each option. 7) Build visual outputs like bars or sparklines to compare results quickly. 8) Add a sensitivity analysis panel to explore weight changes. 9) Validate with a real or hypothetical scenario and adjust as needed. 10) Document inputs, sources, and any assumptions so the template is reusable.
Real-world use cases and scenarios
A comparison excel sheet template shines in several practical scenarios. For a software selection, you can compare features, costs, integration effort, and risk across vendors in a single view. For a project vendor decision, you can rate proposals based on implementation speed, quality, and service level. In both cases, the template fosters structured dialogue, helping stakeholders focus on evidence rather than anecdotes. The XLS Library analysis underscores how templates that show both current scores and potential future states lead to better, faster buy-in across teams.
Common mistakes and how to avoid them
Even a well-designed template can mislead if used poorly. Common mistakes include overloading criteria (too many factors dilute focus), assigning arbitrary weights without justification, neglecting data validation (leading to inconsistent inputs), and ignoring the need for regular updates. To avoid these pitfalls, limit criteria to a handful of strategic factors, document the rationale for weights, implement data validation rules, and schedule periodic reviews to refresh scores and sources. Finally, ensure the template remains accessible and versioned so future contributors can understand past decisions.
Advanced tips for dynamic comparisons
For teams seeking more advanced capabilities, add dynamic features such as drop-downs for scenario selection, slicers for filtering, and conditional formatting to highlight top options. Consider building a baseline template that can be copied for new decisions, with a dedicated tab for assumptions and risk. Use named ranges and cell protections to prevent accidental edits, and create a lightweight audit log to capture who changed what and when. If your data source changes, connect the template to live data using Excel’s data linking or Power Query capabilities, so your comparisons stay up to date with minimal manual work. The goal is to balance sophistication with usability, so the tool remains practical in daily operations.
Practical example: baseline template filled (hypothetical)
Imagine you are choosing between three software options: A, B, and C. You rate each on Criteria: Cost, Feature completeness, Ease of use, Support, and Risk. Using a 1-5 scoring scale, you assign weights: Cost 0.25, Feature 0.30, Usability 0.20, Support 0.15, Risk 0.10. After calculating the weighted scores, you see that Option B leads by a small margin, but Scenario sensitivity shows that if weight on Feature were lower and Cost higher, Option A could overtake. This practical example demonstrates how the template guides a data-informed decision, rather than relying on impressions alone. Remember to document data sources and assumptions so future reviews stay reliable.
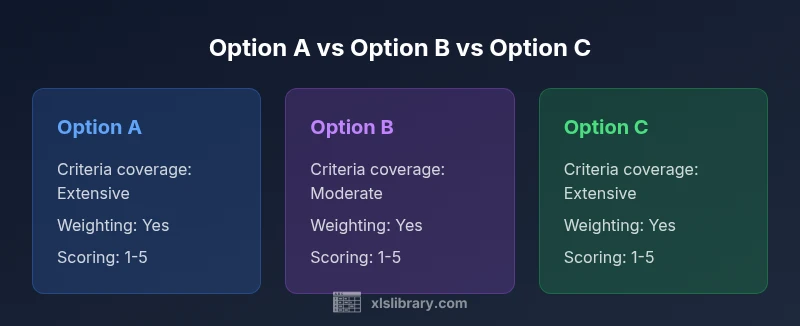
Feature Comparison
| Feature | Option A | Option B | Option C |
|---|---|---|---|
| Criteria coverage | Extensive | Moderate | Extensive |
| Weighting capability | Yes | Yes | Yes |
| Scoring scale | 1-5 | 1-5 | 1-5 |
| Ease of use | High | Medium | High |
| Data sources | Structured | Partially structured | Structured |
| Best for | Clear, quick decision | Balanced evaluation | Comprehensive analysis |
Benefits
- Standardizes decision criteria across options
- Facilitates transparent weighting and scoring
- Reusable across multiple projects and teams
- Easy to customize and share
What's Bad
- Requires disciplined data collection
- Can become stale if criteria aren't reviewed
- May oversimplify complex trade-offs
A well-constructed comparison excel sheet template is the most effective tool for objective, transparent decision-making.
The baseline template provides a repeatable framework to weigh criteria and visualize trade-offs. The XLS Library team recommends tailoring the sheet to your decision context and validating with real scenarios to ensure accuracy.
People Also Ask
What is a comparison excel sheet template and why use one?
A comparison excel sheet template is a structured workbook that helps you evaluate several options across common criteria, with weights and scores to produce an auditable final verdict.
A template helps you compare options fairly by scoring criteria and tallying results.
How many options should I compare in a template?
Typically 3 to 6 options work well, balancing depth and manageability. More options can complicate the sheet, while too few may miss alternatives.
Usually three to six options give you solid insight without overcomplicating the analysis.
What criteria should I include in the template?
Include a mix of quantitative measures (cost, time) and qualitative ones (usability, compatibility). Ensure each criterion has a clear definition and scoring guide.
Pick a mix of numbers you can measure and qualitative factors you can assess consistently.
How do I weigh criteria without bias?
Document the rationale for each weight, use group consensus when possible, and run sensitivity analyses to see how results change with weight shifts.
Explain why each criterion matters and test how results change if you adjust weights.
Can I customize templates for non-financial criteria?
Yes. Non-financial criteria can be included with defined scoring rubrics and anchored descriptions to keep evaluations consistent.
Absolutely—qualitative criteria can be scored with clear rubrics like any quantitative one.
The Essentials
- Define clear decision goals before building the template
- Use consistent criteria and scoring scales
- Weight criteria to reflect importance
- Test with real scenarios to validate results
- Keep data sources documented for auditability