Can You Use Excel Instead of SPSS? A Practical Comparison
Explore whether Excel can replace SPSS for data analysis. A practical, balanced comparison of capabilities, limits, and best-use scenarios for researchers in 2026.

Can you use Excel instead of SPSS? In short, yes for basic and exploratory analyses, but SPSS remains stronger for advanced statistics and reproducibility. This quick take compares capabilities, workflows, and when Excel is sufficient versus when you should reach for SPSS. According to XLS Library, your choice should hinge on data complexity, required reproducibility, and licensing constraints.
Can Excel Replace SPSS? Framing the Question
Understanding whether Excel can replace SPSS starts with recognizing two different roles in the analytics stack. Excel is a ubiquitous, flexible spreadsheet platform that excels at data cleaning, aggregation, and visualization. SPSS is a purpose-built statistical package designed for rigorous analysis, reproducibility, and large-sample workflows. If your project involves straightforward comparisons, descriptive summaries, or quick dashboards, Excel may be sufficient. If you’re conducting multivariate modeling, complex hypothesis testing, or handling nuanced survey data, SPSS tends to outperform Excel. According to XLS Library, the decision should hinge on data complexity, required reproducibility, and licensing constraints rather than a one-size-fits-all rule. In 2026, teams increasingly start with Excel for quick prototyping and then migrate to SPSS or other specialized tools as the analysis matures. The goal of this article is to provide a practical, evidence-based framework for deciding when to stick with Excel and when to move to SPSS. By the end, you’ll know which tool best fits your data challenges and your delivery needs.
When Excel Is a Practical Starting Point
For many business and academic scenarios, Excel offers a friendly entry point into data analysis. Its familiar interface lowers the barrier to entry, and most analysts can perform basic cleaning, merging, and filtering without training. Pivot Tables enable rapid summaries and ad-hoc exploration, while charts and conditional formatting drive storytelling. The Data Analysis ToolPak (built into Excel) provides essential capabilities for descriptive statistics, regression, ANOVA, and t-tests, which covers a lot of everyday research tasks. In practice, Excel shines when datasets are moderate in size, the questions are well-scoped, and the deliverables include shareable spreadsheets or simple reports. As a 2026 reference point, XLS Library has observed many teams using Excel in the early stages of a project to iterate ideas quickly before committing to more specialized software. If you are still learning, start with Excel and map your results in a visual format before considering a transition to SPSS for deeper analysis.
Can you use excel instead of spss in practice?
In practical terms, Excel serves well for quick checks, initial data cleaning, and early-stage insights. It’s common to start in Excel to sketch hypotheses and then move to SPSS when validation becomes essential or when models require more rigor.
What SPSS Brings to the Table
SPSS offers a suite of advanced statistical techniques and a reproducible workflow that many researchers depend on for rigorous inference. It supports complex modeling, like multivariate analyses, logistic regression, and robust handling of survey data, with documented procedures and a consistent interface. SPSS syntax allows you to record steps as repeatable scripts, which improves auditability and peer review. The software is designed to manage large datasets with stability and provides extensive output options, including tables, charts, and standardized reports. For teams in regulated environments or institutions that demand formal project trails, SPSS often reduces the friction of compliance and validation. In 2026, many organizations favor SPSS when the research requires sophisticated analyses, detailed documentation, and easy reproducibility across collaborators.
Data Cleaning and Preparation: Excel vs SPSS
Data cleaning is foundational to any quality analysis. Excel excels (pun intended) at rapid cleaning with Power Query, filtering, deduplication, and merging across sheets. Power Query lets you define repeatable cleaning steps that can be refreshed as data evolves, aligning with agile workflows. SPSS handles cleaning through its data editor, syntax-driven transformations, and built-in procedures that ensure consistency across large datasets. The advantage of Excel is the intuitive, visual workflow; the advantage of SPSS is the ability to enforce consistent data preparation within a formal statistical framework. A practical approach is to use Excel for initial cleaning and structuring, then import a clean subset into SPSS for the statistical phase. This hybrid approach is common in many 2026 projects.
Descriptive Statistics and Basic Inference in Excel
Excel provides a solid baseline for descriptive statistics and simple inferential tests via the Data Analysis ToolPak. You can run descriptive summaries, correlations, simple linear regression, t-tests, and one-way ANOVA with the right setup. The results are easy to visualize and embed in reports. However, the interpretation and nuance of results often require careful scripting and documentation, which SPSS handles more naturally through its output streams and syntax. For quick reconnaissance analyses or teaching scenarios, Excel is a strong starting point. For formal publication-ready analyses, consider supplementing Excel with SPSS or another statistics package to ensure completeness and rigor.
Inferential Statistics: When Excel Falls Short
While Excel covers many standard tests, its inferential toolkit is narrower than SPSS in practice. Complex modeling, multivariate analyses, robust handling of missing data, and extensive diagnostic options are harder to implement in pure Excel. If your project involves multiple imputation, complex survey weighting, mixed models, or advanced hypothesis testing, SPSS provides a more robust environment. A balanced approach may be to perform exploratory analyses in Excel, then move to SPSS for the heavy statistical lifting. If sticking with Excel, you can extend functionality with add-ins or by exporting data to R or Python for advanced methods.
Reproducibility and Workflows
Reproducibility and Workflows
Reproducibility is a core differentiator. SPSS allows you to capture steps in a script (syntax) that can be shared, versioned, and rerun with different data. Excel relies more on manual workflows, macros, and workbook-level dependencies, which are easy to modify and share but harder to audit at scale. For teams that require auditable processes, SPSS contributes a ready-made reproducible trace. In hybrid environments, practitioners document Excel steps carefully and use SPSS scripts to lock in the statistical portion of the analysis. In 2026, the trend is toward hybrid pipelines: use Excel for data prep and SPSS for statistics to balance speed and rigor.
Data Size, Performance, and Licensing
Excel scales well for many mid-sized datasets, but it has practical limits. Modern Excel can handle well over a million rows, yet performance degrades with complex formulas and large pivot caches. Licensing is another factor: Excel typically comes with an Office license, which many organizations already own. SPSS licenses are separate investments, often justified by the need for advanced analytics, robust reporting, and enterprise-wide deployment. For projects with heavy data and formal requirements, SPSS can deliver more consistent performance and governance. When budget and licensing are tight, Excel remains a cost-effective starting point, particularly for prototyping and smaller projects.
Integrations and Extensibility
Excel’s ecosystem has expanded dramatically. Power Query and Power BI integration enable advanced data discovery and visualization. R and Python integrations through add-ins extend analytical reach beyond built-in tools. SPSS also supports scripting (SPSS syntax) and can integrate with R to broaden its analytical repertoire. The key is to design workflows that leverage the strengths of each tool: Excel for data shaping and exploration, SPSS for disciplined statistical analysis and reproducibility. In 2026, many analysts build hybrid pipelines to maximize efficiency while preserving rigor.
Practical Framework: Choosing Excel or SPSS by Use Case
A practical decision framework begins with the data size, analysis complexity, and the required level of reproducibility. If data are small, analyses are straightforward, and the deliverable is a quick report or dashboard, Excel is usually enough. If you require complex models, formal hypothesis testing, or institutional-grade reproducibility, SPSS is often the safer choice. For many projects, a hybrid approach yields the best balance: clean and shape data in Excel, then execute advanced statistics in SPSS. Finally, align your choice with licensing, team skills, and project timelines to minimize friction and maximize insight. In 2026, this approach helps teams scale from initial exploration to robust, publishable results.
Practical Tips and Best Practices
- Start with a clearly defined analysis plan and a data dictionary. This reduces ambiguity when moving between tools.
- Use Power Query for repeatable cleaning steps; document every transformation.
- Keep raw data separate from worked copies to protect integrity and facilitate re-runs.
- When using Excel, build transparent formulas and utilize named ranges to avoid misinterpretation.
- In SPSS, organize your syntax to reflect each analysis stage and maintain a clean output log.
- Consider exporting intermediate results for cross-tool validation and auditing.
- Maintain a simple, reproducible folder structure for datasets, scripts, and outputs.
- Always perform sensitivity checks to ensure conclusions are robust to minor data changes.
Common Pitfalls and How to Mitigate
Common pitfalls include overreliance on Excel’s built-in charts for statistical interpretation, under document the analysis steps, and failure to manage data provenance. To mitigate these pitfalls, keep a running log of data transformations, use version control for important workbooks, and benchmark Excel results against SPSS outputs for critical analyses. When working with sensitive data, ensure proper protection, encryption, and access controls. In 2026, practitioners who combine careful documentation with hybrid tool use tend to achieve more reliable results than those who rely on single-tool workflows.
Comparison
| Feature | Excel | SPSS |
|---|---|---|
| Data Cleaning & Preparation | Power Query + repeatable steps | Advanced data preparation and scripting |
| Descriptive Statistics & Reporting | PivotTables and basic stats | Extensive descriptive statistics and reporting |
| Inferential Statistics | t-tests, regression via ToolPak | Broad suite of tests and modeling capabilities |
| Reproducibility & Automation | Macros and workbook-level workflows | Syntax-driven, auditable analyses |
| Handling Large Datasets | Good for moderate sizes; performance varies | Designed for larger-scale, stable analyses |
| Learning Curve & Accessibility | Low to moderate; familiar interface | Steeper but more powerful for experts |
| Cost & Licensing | Often included in Office license | Separate SPSS license required (per-user) |
| Best For | Small to mid-size analyses; rapid prototyping | Academic/research; advanced statistics and governance |
Benefits
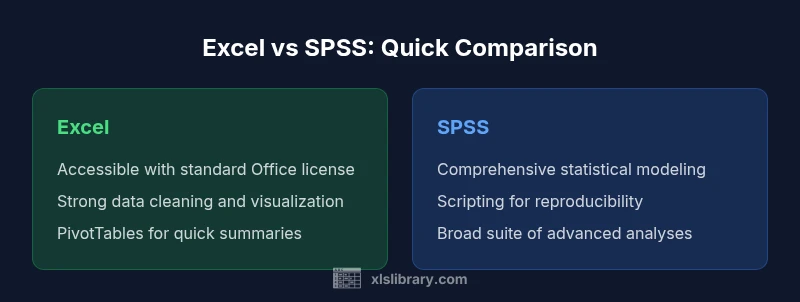
- Excel is readily accessible with common Office licenses
- Power Query and Pivot Tables enable fast data exploration
- Cost-effective for basic analyses and quick prototyping
- Familiar interface reduces the learning curve for many users
- Integrates with Power BI and other Microsoft tools
What's Bad
- Excel lacks built-in support for some advanced statistical modeling
- Handling very large datasets can be slower and prone to errors
- Reproducibility can be hard without careful version control
- Some advanced tests require add-ins or external tools
Excel is best for starting points and fast-turnaround analyses; SPSS excels for advanced statistics and rigorous reproducibility.
Use Excel for data cleaning, exploration, and simple inferences. Move to SPSS when your analyses demand robust statistical modeling, formal documentation, and audit-friendly workflows.
People Also Ask
Can Excel replace SPSS for all statistical analyses?
No. Excel covers basic statistics and some tests, but SPSS provides a wider range of advanced analyses and a more reproducible workflow. For rigorous research, SPSS is often necessary.
No. Excel handles basics; SPSS is needed for advanced statistics and reproducibility.
What analyses can Excel handle well?
Excel handles descriptive statistics, correlations, basic regression, t-tests, and one-way ANOVA via the Data Analysis ToolPak. It’s great for quick checks and initial exploration.
Excel does descriptive stats and some inferential tests well.
What are the main limitations of Excel for statistics?
Limited advanced modeling, fewer robust diagnostics, potential reproducibility issues, and performance constraints with very large datasets. For complex analytics, SPSS or other tools are preferable.
Limitations include fewer advanced models and reproducibility challenges.
Is there a way to mimic SPSS workflows in Excel?
You can mimic workflows by combining Power Query for cleaning, pivot tables for exploration, and the Data Analysis ToolPak for basic tests; however, full replication of SPSS’s extensive modeling is unlikely.
You can approximate SPSS workflows in Excel but not fully replicate them.
Should researchers switch to SPSS?
Consider SPSS when your project requires advanced statistics, robust documentation, and easy audit trails. If the analyses are straightforward and licenses are a constraint, Excel can suffice.
Switch to SPSS if you need advanced stats and reproducibility.
Are there free alternatives to SPSS?
Yes. R and Python (with libraries like statsmodels and scikit-learn) are free and powerful. Excel with add-ins can cover many needs, but full parity with SPSS often requires a dedicated statistics environment.
R and Python are common free alternatives; Excel can bridge some gaps.
The Essentials
- Define your analysis scope before choosing tools
- Leverage Excel for data prep and visualization
- Reserve SPSS for advanced modeling and large datasets
- Prioritize reproducibility with clear workflows
- Consider licensing and ecosystem when deciding