Power Query: Excel vs Power BI — A Practical Guide
Compare Power Query in Excel and Power BI, focusing on data prep, modeling, sharing, and when to choose each for analytics. Practical cross-tool Power Query workflows.

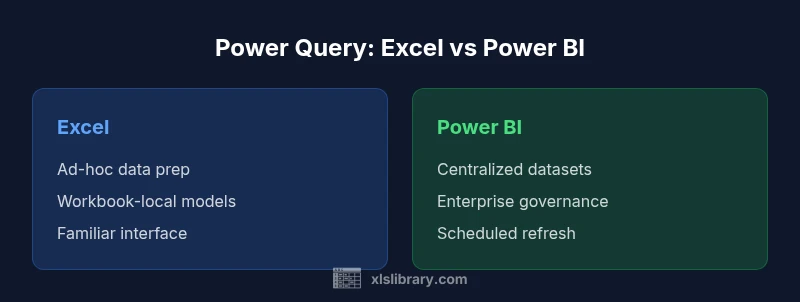
power query excel vs power bi demonstrates how both tools share Power Query as the ETL backbone but target different use cases. Excel enables quick, ad-hoc data prep for personal analysis, while Power BI scales data models and governance for dashboards. In short, use Excel for fast prep and Power BI for enterprise reporting, with Power Query as the common ETL layer.
What Power Query does across Excel and Power BI
According to XLS Library, power query excel vs power bi is best understood as a shared ETL backbone rather than two independent products. The same Power Query engine and M language power both platforms, so queries built in Excel can often be reused in Power BI with only minor tweaks to data sources or modeling context. Practically, this means your core data shaping skills transfer across environments, reducing the learning curve for teams working in both ecosystems. Excel remains the friendly surface for quick prep, prototyping, and on-the-fly analysis, while Power BI extends those transformations into scalable data models with governance, versioning, and distribution at scale. The end result is a reproducible data preparation pipeline that travels from workbook to dashboard and back, as needs evolve, across the MS toolkit.
Core Architectural Differences
Power Query in Excel and Power BI share the same underlying engine, but the user experience and system constraints differ. Excel emphasizes workbook-level queries and personal reuse, while Power BI focuses on centralized data models, relationships, and a publish-ready dataset. In practice, you’ll see differences in how queries are stored (workbook vs model), how data is refreshed (local vs centralized refresh), and how metadata is managed (per-workbook vs dataset-wide). Yet the editing experience—applied steps, M formula bar, and UI-driven transformations—remains remarkably familiar across both tools. This consistency is a core advantage, enabling cross-tool collaboration and smoother onboarding for analysts.
Data Source Connectivity and Transformation Capabilities
Both Excel and Power BI connect to a wide array of sources: files (CSV, Excel, JSON), databases (SQL Server, Oracle, Azure SQL), web services, and cloud platforms. Power Query’s transformation capabilities are feature-rich: filtering, joining, grouping, pivoting, unpivoting, custom columns, and parameterized queries. The key difference lies in reach: Excel thrives on local or small-team datasets, while Power BI targets larger datasets, incremental refresh, and scheduled data preparation. For the keyword power query excel vs power bi, the practical takeaway is to design transforms that can be parameterized and reused in both contexts, reducing duplication and errors in data prep.
Data Modeling and Storage: Excel vs Power BI
In Excel, transformed data typically lands in tables inside the workbook, ready for pivot tables, charts, and lightweight modeling. In Power BI, transformed data is loaded into a star-schema model with relationships, measures, and a semantic layer powering dashboards. The distinction matters for governance and scalability: Power BI datasets can be refreshed on a schedule, be shared via apps, and participate in centralized governance, while Excel workbooks are more prone to version drift and local storage constraints. The best practice is to use Power Query to produce clean, well-documented data structures, then decide whether to land them in a workbook for quick analysis or in a Power BI model for enterprise reporting.
Data Shaping and Transformation Patterns
Across both tools, you’ll use the same core patterns: import, clean, shape, and load. Common steps include removing duplicates, trimming whitespace, parsing text, merging data from multiple sources, and creating calculated columns. When working across Excel and Power BI, aim for modular queries with clear parameterization so the same logic can be invoked in either environment. This cross-tool consistency reduces maintenance overhead and ensures that data quality controls—such as invalid value checks or data-type standardization—are enforced uniformly.
Performance and Scalability Considerations
Performance characteristics differ as datasets scale. In Excel, large transforms can slow down workbooks and risk hitting memory limits, especially on 32-bit installations or older machines. Power BI offloads heavy lifting to a more scalable engine, enabling larger datasets and faster refreshes, particularly when using DirectQuery or optimized models. However, complex queries in Power BI still require thoughtful data modeling and careful data source selection to prevent over-fetching. The overarching principle is to keep transformations lean, push processing to the right place (model vs. workbook), and test refresh times as data volumes grow.
User Experience and Learning Curve
Both tools share a common UI paradigm for Power Query: the Applied Steps pane, the query editor, and the M language editor. For newcomers, the learning curve is modest but non-trivial, especially when diving into advanced functions, custom columns, and error handling. For teams already familiar with Excel, picking up Power Query in Excel is often faster; for teams moving toward dashboards and centralized reporting, the Power BI workflow offers more structure and governance. In either case, dedicating time to practice with real-world datasets accelerates mastery and reduces friction when scaling up.
Collaboration, Sharing, and Governance
Collaboration patterns differ. Excel workbooks are easy to share but difficult to govern once distributed; multiple users editing the same workbook can create conflicts, version drift, and inconsistent data sources. Power BI supports centralized datasets, role-based access, and governance workflows, which improves control over data lineage and user permissions. When you apply Power Query in Power BI, you gain the ability to enforce standardized data transformations across the organization while maintaining secure, auditable data flows. The result is a more reliable analytics environment with clearer ownership.
Use-Case Scenarios: When to Reach for Excel vs Power BI
For ad-hoc analysis, budget trackers, quick data cleanup, or a self-service workbook with lightweight dashboards, Excel is often the right starting point. When your goal is scalable analytics, multiple users consuming dashboards, and a governed data layer, Power BI shines. In mixed environments, you can transfer validated queries from Excel to Power BI and vice versa, preserving the transformation logic while adapting the data model. The practical approach is to design Power Query steps to be platform-agnostic wherever possible, then fine-tune the final destination based on user needs and governance requirements.
Licensing, Cost, and Accessibility Considerations
Power Query is included with Excel and Power BI, but licensing differences influence access to datasets, refresh capabilities, and sharing options. Excel users typically rely on personal licenses or Office 365 subscriptions, while Power BI licensing adds options for Pro or Premium capacity, affecting distribution and refresh limits. When planning deployment, consider both the cost of the software and the value of centralized data models, governance, and cross-team collaboration. The goal is to balance initial learning investments with long-term efficiency gains from reusable Power Query logic.
Integration and Workflow Across the Microsoft Stack
Power Query acts as a bridge across the Microsoft data ecosystem. You can create a query in Excel, load the cleaned data to a workbook, then reuse the same query in Power BI by connecting to the same data source or dataset. This cross-tool integration enables a consistent data preparation layer that reduces duplication and errors. Additionally, you can leverage connectors to SharePoint, Teams, and Azure services to embed Power Query-driven datasets into broader analytics workflows. The seamless integration across the Microsoft stack is a key driver for teams pursuing unified data strategies.
Best Practices for Power Query Across Excel and Power BI
Adopt a modular design: break transformations into small, testable steps. Use parameterized queries to adapt sources without rewriting logic. Document each step with comments so future maintainers understand intent. Favor loading into a staging table or a separate query to keep the final model clean. Implement error handling and data-type standardization early in the process. Finally, establish a versioning and testing routine to catch regressions before deployment.
The Path Forward: Trends and Pitfalls to Watch
As Microsoft continues to evolve Power Query, expect tighter integration with the data modeling features, improved performance for large-scale datasets, and more automated governance options. Common pitfalls include overcomplicating queries, ignoring data lineage, and underestimating refresh schedules. Staying ahead means embracing model-driven design, investing in cross-functional training, and building a library of reusable queries that work across both Excel and Power BI.
Comparison
| Feature | Power Query in Excel | Power Query in Power BI |
|---|---|---|
| Data modeling and storage | Workbook-level tables and lightweight analysis | Centralized datasets with relationships and measures |
| Data source connectivity | Wide range of sources; local workbook scope | Broad sources with scalable, enterprise-oriented refresh |
| Query reuse | Often reusable within a workbook or external connections | Designed for reuse across datasets and dashboards |
| Governance | Less centralized governance; more manual control | Stronger governance with role-based access and lineage |
| Refresh capabilities | Manual or ad-hoc refresh in desktop environments | Scheduled, incremental refresh in Power BI service |
| Best for | Ad-hoc analysis, personal data prep | Enterprise dashboards, scalable analytics |
| Learning curve | Gentler for individuals familiar with Excel | Deeper for organizational deployment and modeling |
| Licensing impact | Licensed with Office or Office 365 subscriptions | Includes Power BI Pro or Premium capabilities |
Benefits
- Unifies ETL across Excel and Power BI
- Enables cross-tool reuse of queries to save time
- Supports repeatable, auditable data prep
- Improves collaboration when used in Power BI
What's Bad
- Steep learning curve for advanced M features
- Performance bottlenecks with very large datasets in Excel
- Licensing complexity when scaling to Power BI service
- Potential for drift if not governed in a centralized way
Excel for quick prep; Power BI for scalable analytics
Power Query unifies data transformation across both tools. Use Excel for rapid analysis and Power BI when governance and large-scale dashboards matter most. The shared ETL layer makes cross-tool workflows efficient and reproducible.
People Also Ask
Can I reuse Power Query queries between Excel and Power BI?
Yes. Power Query queries can often be reused with minimal adjustments when moving from Excel to Power BI or vice versa. Focus on parameterizing sources and keeping transformations modular to maximize portability.
Yes. You can reuse many Power Query queries between Excel and Power BI with small tweaks. Keep transformations modular for easy portability.
Do Power Query features differ between Excel and Power BI?
Core Power Query functionality is the same, but availability and governance options differ by platform. Power BI emphasizes centralized datasets and governance, while Excel focuses on workbook-level data and ad-hoc analysis.
The core features are similar, but Power BI adds governance and centralized datasets that Excel doesn’t. Excel centers on workbook-level data.
Is Power Query required in Power BI?
Power Query is the primary ETL tool in Power BI for loading and transforming data before modeling. While you can perform some operations in visuals, the recommended approach is to use Power Query for data prep.
Power Query is the main ETL step in Power BI for loading and shaping data before modeling.
Which tool should I choose for data cleaning?
If you need a quick cleanse for personal use, Excel with Power Query is convenient. For team-wide cleanliness, governance, and dashboards, Power BI provides stronger collaboration and reproducibility.
For quick cleanses, Excel helps; for team-wide data cleaning with governance, use Power BI.
How should I handle large data volumes with Power Query?
Push processing toward the data model in Power BI when possible, use query folding to push work back to the data source, and avoid loading huge intermediate results into Excel. In both tools, minimize transformations on very large results.
For large data, push work to the data model and avoid big intermediate loads in Excel.
What licensing is needed to use Power Query across both apps?
Power Query is included with both Excel and Power BI. Licensing differences affect refresh, sharing, and governance features, so plan accordingly for scale.
Power Query is included with Excel and Power BI; licensing differences impact governance and refresh options.
The Essentials
- Embrace a common Power Query core across tools
- Use modular, parameterized queries for reuse
- Reserve Power BI for scalable data models and governance
- Plan for centralized data refresh and lineage
- Invest in cross-training for Excel and Power BI teams