Gantt Chart in Excel: A Practical Step-by-Step Guide
Learn to build a robust Gantt chart in Excel with a repeatable workflow. This guide covers data setup, stacked-bar visuals, milestones, and sharing updates with your team.

You can create a Gantt chart in Excel by organizing your project tasks in a table with start dates and durations, then using a stacked bar chart with hidden base series to visualize progress. You’ll need a data table, a chart, and formatting rules. This method works in recent Excel versions (Windows or Mac).
Why Gantt charts matter in Excel
Gantt charts are visual roadmaps for project timelines, showing when tasks start, how long they last, and how they relate. In Excel, you don’t need specialized project software to unlock these insights for small teams or personal projects. The approach is approachable, customizable, and highly repeatable. According to XLS Library, Gantt charts in Excel empower teams to plan, track, and communicate progress using a familiar toolset. This democratizes project visibility, reduces meetings focused on status updates, and helps new contributors understand schedules quickly. By mastering a few core techniques—data structure, stacked-bar visuals, and careful formatting—you can build charts that scale with your project’s complexity. The result is a living timeline that updates as dates shift, dependencies change, or milestones are added.
Beyond aesthetics, Excel-based Gantt charts support scenario planning. You can duplicate a template for different projects, compare baseline plans with actual progress, and export visuals for reports. If you work in cross-functional teams, a consistent Excel chart becomes a single source of truth that stakeholders can review without learning new software. This makes the skill broadly valuable for aspiring and professional Excel users seeking practical, approachable guides. The XLS Library team emphasizes that starting simple and iterating to include milestones, dependencies, and baselines yields the strongest long-term results.
Understanding the data structure for a Gantt chart
A successful Gantt chart in Excel starts with well-structured data. At minimum, you need a Tasks column, a Start Date, and a Duration (in days). Depending on your needs, you can add End Date, Progress, Milestones, and Dependency columns. The Start Date anchors the task on the timeline, while Duration converts to the length of the bar. Milestones can be represented as special single-day tasks with zero duration or a separate marker column. Dependency data—like which task Must start after which—helps in more advanced analyses, though you can implement a simple chart without it. Consistency in date formats and units is essential; mixed formats create misalignment and confusion. As you prepare your data, think about how you will interpret the chart: what decisions will the visualization drive, who will view it, and how updates flow back into the data sheet.
Planning the naming conventions now saves headaches later. Use concise, descriptive task names like “Design Wireframes,” “Develop Backend,” and “QA Testing.” Keep dates in a standard library of formats (for example, yyyy-mm-dd or mm/dd/yyyy) and avoid spaces or special characters that Excel might misinterpret. If your project involves milestones, plan where they appear on the timeline and how progress will be reflected. Finally, consider adding a Progress column to illustrate completion percentages, which can be color-coded for quick scanning.
Setting up a basic Gantt chart in Excel
The quickest path to a working Gantt chart is a stacked bar chart built from a task table. Start by listing tasks with their Start Date and Duration. Next, create a second data series representing the Lead or Wait time (optional) or a baseline. Then insert a Stacked Bar Chart and flip the data orientation so dates align to the left. Hide the first series (the baseline) to reveal the visible duration bars starting at each task’s Start Date. This creates the impression that bars begin on their respective start dates and extend for the duration. You can add gridlines, adjust axis scales, and customize colors to enhance readability. Naming new series and using named ranges helps with later edits. If you add milestones, format those bars distinctly to stand out from regular tasks.
A key technique is using a hidden helper column for the offset so the visible bars start at the correct date. For example: Offset = Start Date - Project Start Date; then set the first bar series to Offset and the second to Duration. This separation is what makes the Gantt shape possible in a simple Excel chart. Remember to save versions as templates so you can reuse the framework for future projects. Excel’s built-in charting tools, when paired with clean data, deliver a robust, reusable solution for visual planning.
Enhancing visuals: formatting and milestone markers
Once your basic Gantt chart is visible, you can enhance readability with formatting. Use distinct colors for tasks, milestones, and critical-path indicators. Add data labels sparingly to avoid clutter, typically for milestone dates or completion percentages. Milestones can be represented with a different chart type (e.g., a point marker) or a shape overlay to differentiate from task bars. Conditional formatting rules can drive color changes based on status (not started, in progress, completed). If your chart includes dependencies, consider drawing connector lines or using annotation callouts to illustrate relationships. Accessibility matters: ensure color contrast is high and fonts remain legible when printed. Finally, provide a small legend and a brief description of how to interpret the chart for new viewers. For long-running projects, split the timeline into quarterly sections to maintain clarity as the chart grows.
Practical examples and templates
Templates are powerful when you’re building charts for multiple projects. A simple template includes a Tasks column, Start Date, Duration, and a Duration-based stacked bar setup. You can create a standalone workbook or a template file to reuse across engagements. Consider adding a Summary row at the top that aggregates total duration, counts tasks, and flags overdue items. Real-world templates often include Milestones, Progress, and Dependency columns to enable more advanced planning. If you’re sharing with non-technical teammates, include a short legend and a one-paragraph guide on how to read the chart. The goal is to provide a practical, repeatable workflow that new team members can adopt quickly without needing extra software. As you gain experience, you’ll learn which accents and annotations make your chart most actionable for different audiences.
Common pitfalls and troubleshooting
Several common issues can derail a Gantt chart in Excel. Inconsistent date formats, misaligned axes, and hidden data series are frequent culprits. If bars appear off the timeline, double-check your Start Date and the offset calculation. Large projects can overwhelm a chart; in such cases, consider splitting the timeline into multiple sheets or using a filtered view for stakeholders. If milestones aren’t distinguished, review the color scheme and ensure the milestone data is configured correctly (zero-duration tasks or a dedicated Milestone column). Remember to frequently save backups and test updates by changing a date to verify the chart responds as expected. Finally, keep your chart’s scope tight: too many tasks on one chart reduce clarity and increase the risk of misinterpretation.
Advanced tips: dependencies, baselines, and updates
For more control, introduce dependencies by marking predecessor-successor relationships and scheduling adjustments accordingly. A baseline can be stored as a separate data series to compare planned versus actual progress. Use Excel’s filtering features to create dynamic views, such as showing only critical tasks or overdue items. When updating dates, maintain an audit trail by recording who changed what and when. If you need to share the chart, export a clean image or a PDF, or publish a shareable workbook link. Finally, document your workflow in a short readme within the workbook so future users understand the data structure and formatting decisions. The more you automate with formulas and named ranges, the more scalable your Gantt chart becomes.
How to share and maintain your Gantt chart in Excel
Sharing a Gantt chart effectively means providing context and ensuring maintainability. Create a small instruction panel within the workbook that explains data entry rules, date formats, and how to refresh the chart when inputs change. Use named ranges for core data to simplify future edits, and consider protecting the sheet to avoid accidental overwrites while allowing collaborators to update progress. Schedule regular reviews of the data to keep the chart accurate, especially for long-running projects with shifting timelines. When you distribute reports, include a quick summary of key milestones and any upcoming dates to keep stakeholders aligned.
Tools & Materials
- Microsoft Excel (Windows or Mac)(Latest version with built-in charting tools (365/2019+ recommended))
- Data template for tasks(Columns: Task Name, Start Date, Duration, End Date (optional), Milestones (optional), Progress (optional))
- Sample project data(Optional starter file to practice building the chart)
- Milestone and dependencies plan(Optional column to mark milestones and task dependencies)
- Printer or PDF export(Optional for sharing static reports)
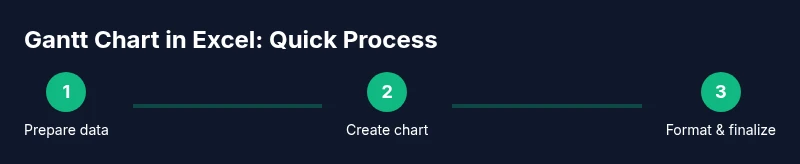
Steps
Estimated time: 20-40 minutes
- 1
Prepare your data
Create a table with Task, Start Date, and Duration. Add optional columns for End Date, Milestones, and Progress. Ensure dates are in a consistent format and that durations are expressed in whole days for straightforward charting.
Tip: Use named ranges (e.g., StartDate, Duration) to simplify formulas. - 2
Insert a stacked bar chart
Select your data and insert a stacked bar chart. This creates bars that represent duration, but you’ll adjust the data so bars appear to start on their Start Date. You may need a helper column for the offset.
Tip: If Excel auto-creates a column for End Date, you can ignore it for the basic chart. - 3
Create the offset and base series
Add an Offset column equal to Start Date minus Project Start. Use this as the first stacked series and your Duration as the second. This positions each bar along the timeline.
Tip: Format the first series to be invisible (no fill) to reveal the actual duration bars. - 4
Hide the base and format the timeline
Hide the offset/base series so only the duration bars show. Adjust the horizontal axis to match your project timeline, and apply colors to distinguish tasks clearly.
Tip: Lock major gridlines or set a fixed date axis for consistency across updates. - 5
Add milestones and progress
Add a Milestones column and format milestone bars distinctly (e.g., diamonds or a different color). If you track progress, show a progress bar overlay or use data labels to reflect percent complete.
Tip: Keep milestones visually distinct to avoid confusion with regular tasks. - 6
Review, save, and share
Review data accuracy, save a template, and export or share the workbook. Consider creating a one-page summary for stakeholders and keeping a changelog for date updates.
Tip: Create a quick-reference guide within the workbook for new users.
People Also Ask
What is a Gantt chart in Excel and when should I use it?
A Gantt chart in Excel is a timeline visualization where tasks are shown as bars along a calendar. It helps plan, track, and communicate project progress. Use it for small to medium projects when you want a quick, shareable view without extra software.
A Gantt chart in Excel is a timeline of tasks shown as bars. It helps plan, track, and share progress without needing special software.
Do I need special add-ins to create a Gantt chart in Excel?
No special add-ins are required for a basic Gantt chart in Excel. You can build it with a simple data table and a stacked bar chart. More advanced features, like dependencies, can be added with extra calculation steps.
No add-ins are needed for a basic Gantt chart, just a table and a stacked bar chart.
Which version of Excel is best for Gantt charts?
Any modern version of Excel supports the core techniques for a Gantt chart: a data table and a stacked bar chart. Excel for Microsoft 365, Excel 2019, and later all work well for these steps.
Any current Excel version works for a basic Gantt chart using a stacked bar chart.
How can I update the chart when dates change?
Keep your data table the single source of truth. When dates or durations change, refresh the chart by updating the underlying data or reapplying the chart’s data range. If you use formulas, the chart updates automatically.
Update the data, and the chart refreshes automatically if formulas drive the visuals.
How do I include dependencies in an Excel Gantt chart?
Dependencies can be represented indirectly by adjusting start dates based on predecessor tasks. This may require extra columns and formulas to set Start Date = MAX(End Dates of predecessors) + buffer.
You can model dependencies with extra calculations that adjust start dates based on predecessors.
Watch Video
The Essentials
- Define data structure before charting.
- Use a stacked bar chart to simulate a Gantt timeline.
- Format and label clearly for stakeholder readability.
- Plan for maintenance: templates, milestones, and updates.