Is SPSS harder than Excel? A practical comparison for analysts
An analytical, evidence-based comparison of SPSS vs Excel, covering learning curves, interfaces, data handling, statistics breadth, collaboration, and licensing to help analysts choose wisely.

Is SPSS harder than Excel? In practice, many analysts find Excel easier for basic tasks while SPSS offers stronger statistical capabilities. The learning curve is steeper for SPSS due to syntax and menu-driven workflows, but both tools become efficient with structured training. This comparison lays out where each shines and where to invest up-skilling.
Core question and scope
The practical question often surfaces: is spss harder than excel? For novices tackling simple datasets, Excel feels more approachable because its interface and formulas map to everyday tasks. However, when analysts ask is spss harder than excel, they mean the broader scope: getting rigorous statistics, validating assumptions, and documenting a reproducible workflow. According to XLS Library, Excel remains the dominant entry point for many teams due to its ubiquity and flexible data prep capabilities, while SPSS provides structured statistical procedures, scripting options, and outputs that align with research standards. This article compares both tools across learning curves, interfaces, data handling, statistical breadth, collaboration, and licensing. It’s not a verdict on which is universally better; it’s a practical guide for deciding based on your project profile, data size, and governance needs. Throughout, we focus on real-world tasks: data cleaning, basic regressions, frequency analyses, and producing audit trails that teams can share with stakeholders. By the end, you’ll see where the friction points are and where to invest time to reach parity.
What each tool is best at
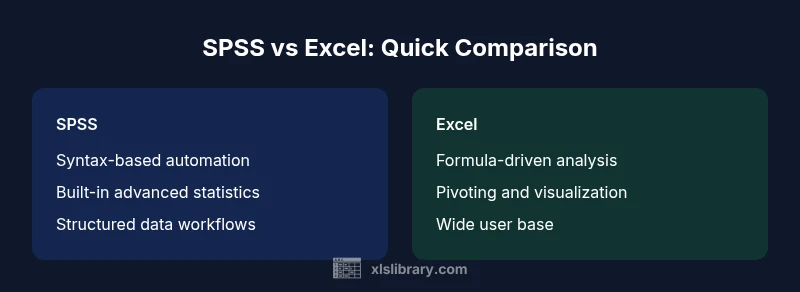
Excel is typically exceptional for quick data prep, lightweight analytics, visualization, and dashboards that stakeholders can grasp immediately. SPSS excels when the aim is formal statistics, reproducible workflows, and standardized reporting. Excel’s strength lies in day-to-day data manipulation, formula-driven analysis, and broad accessibility; SPSS offers robust statistical tests, a structured GUI for non-programmers, and scripting options that promote reproducibility. Both tools support data cleaning, but their built-in capabilities address different phases of the analytics lifecycle. When deciding between them, consider not just the task at hand, but also the team's existing skill set and governance requirements. For many teams, Excel handles the initial exploration, while SPSS handles the confirmatory analysis and documentation that underpins credible results.
Learning curve: conceptual vs practical
Learning curve often defines the perceived difficulty: Excel’s learning curve is more gradual for users who are comfortable with spreadsheets, as many formulas and shortcuts build on prior routines. SPSS introduces a different paradigm: statistics-centric concepts, exact procedure naming, and syntax for advanced analyses. The initial hurdle is understanding data types, variable labeling, and the difference between procedural dialog boxes and scripting. For those coming from a pure Excel background, SPSS syntax can feel foreign, requiring discipline to structure projects, annotate code, and reuse scripts. However, SPSS tends to reward learners with clearly defined statistical workflows and consistent outputs, which can pay off in complex projects. Over time, the line between “hard” and “easy” shifts toward how well you map your goals to each tool’s strongest capabilities.
Interface, syntax, and scripting: what to expect
Excel relies on a familiar grid interface, with menus, ribbons, and a rich set of formulas that enable ad hoc analyses. SPSS presents a more task-oriented environment: dialog-based menus for standard tests, coupled with a dedicated syntax language for advanced operations. The SPSS syntax, while intimidating at first, provides a reusable, auditable way to reproduce results. In contrast, Excel formulas and VBA offer immediate, tactile feedback, but can become error-prone when used across large projects. Understanding the trade-off between interactive dialog usage and script-driven automation is central to choosing the right workflow for your team. The practical takeaway is to blend both approaches when needed: use dialog boxes for quick runs and scripts for reproducible pipelines.
Data handling and transformation capabilities
Both tools can import a wide range of data sources, but their strengths lie in different areas. Excel shines with flexible data manipulation, pivot tables, and conditional formatting that help you see patterns quickly. SPSS emphasizes predefined data structures, labeling, and robust handling of categorical variables, with built-in procedures that minimize the need for external calculations. When datasets scale, SPSS tends to provide more stable performance for statistical tasks, especially in a controlled environment. Excel can manage reasonably large datasets, but performance may degrade as files grow or as you rely heavily on complex formulas. A practical strategy is to standardize data in Excel for initial exploration, then move to SPSS for formal modeling and archival of reproducible outputs.
Statistical breadth and workflow efficiency
SPSS offers a comprehensive suite of statistical tests, from descriptive statistics to advanced multivariate models, with outputs designed for reporting and publication. Excel provides many statistical capabilities through formulas, add-ins, and pivot-based analyses, but its built-in tests are not as extensive as those in SPSS. For analysts prioritizing formal inference, SPSS reduces the need to assemble multiple formulas and external tools. For those focused on rapid guess-and-check analyses, Excel’s flexibility and interoperability can shorten the time to insight. The decision boils down to your need for formal statistical rigor versus rapid exploratory analysis. In many scenarios, using both tools in tandem yields the best balance between speed and credibility.
Reproducibility, automation, and collaboration
Reproducibility is a core concern in analytics. SPSS’s syntax-based workflow makes it straightforward to reproduce analyses across teams, provided the scripts are well-documented. Excel’s reproducibility depends on how well workbooks are structured, named ranges, and the discipline of version control—without robust scripting, teams may end up duplicating work. Collaboration dynamics diverge further: SPSS projects can be centrally managed and audited; Excel files are easy to share but can create versioning conflicts. Modern teams often mitigate this by combining shared data models in Excel with SPSS scripts for the actual analysis, supported by clear governance and documented metadata.
Costs, licensing, and access for teams
Licensing models shape the practical feasibility of using SPSS versus Excel. Excel typically ships with office suites or is accessible via cloud subscriptions, lowering the barrier for many individuals and teams. SPSS requires a separate license, which can influence adoption in smaller teams or organizations with limited IT budgets. Beyond upfront costs, ongoing maintenance, updates, and user management contribute to the total cost of ownership for each tool. It’s important to factor in training expenses as well, since the time spent upskilling staff directly impacts long-term value. Budget-conscious teams often weigh the speed-to-value of Excel against the long-term statistical capabilities SPSS provides.
Scenarios where each shines: decision heuristics
If your remit centers on quick data wrangling, visualization, and dashboard-ready outputs, Excel proves highly effective. If your objective is formal statistical analysis, modeling, and reporting aligned with research standards, SPSS excels. The best practice is to map the project’s analytics phase to the tool that fits that phase best, and plan for cross-tool pipelines when needed. Teams should also consider existing skill sets, training capacity, and governance requirements to determine the most cost-efficient and reliable setup.
Practical steps to choose and upskill
Start by cataloging your typical tasks: data cleaning, descriptive statistics, inferential tests, and reporting needs. If most tasks are exploratory or visualization-focused, begin with Excel optimization—master key formulas, pivot tables, and basic charts. If formal statistics and audit trails are essential, allocate time to learn SPSS syntax, common procedures, and how to document outputs for reproducibility. Build a pragmatic upskilling plan that pairs short, task-based training with hands-on projects. Finally, establish a lightweight workflow that uses Excel for data preparation and SPSS for statistical analysis to leverage the strengths of both tools.
Comparison
| Feature | SPSS | Excel |
|---|---|---|
| Learning curve | Steeper due to syntax and specialized terminology | Gentler; relies on familiar spreadsheet concepts |
| Interface and scripting | GUI dialogs plus SPSS syntax for advanced tasks | Spreadsheet grid with formulas, charts, and VBA options |
| Data handling | Strong structure for variables; good data integrity controls | Flexible data manipulation and quick prep with pivoting |
| Statistical breadth | Broad range of built-in tests and models | Good statistical support via formulas/add-ins; lighter out-of-the-box |
| Reproducibility and automation | High when using scripts; centralized script management | Moderate; reproducibility relies on workbook structure and version control |
| Collaboration and sharing | Requires license; outputs easily audited but sharing requires care | Easier to share; files can be edited by multiple users with cloud collaboration |
| Cost and licensing | License-based, often enterprise-scale | Often bundled with office suites or affordable per-user options |
Benefits
- Formal statistical workflows with reproducible outputs
- Strong support for research standards and audits
- Clear separation of data preparation and analysis tasks
- Broad community and documentation for statistics
What's Bad
- Steeper learning curve for beginners
- Require dedicated licenses for SPSS in many organizations
- Scripting in SPSS may feel restrictive compared to general-purpose programming
Excel for quick, flexible data work; SPSS for formal statistics and reproducible analyses.
The choice hinges on task priorities: if you need rapid data prep and visualization, Excel. If rigorous statistics and reproducibility are paramount, SPSS shines. In many teams, a blended workflow—Excel for prep, SPSS for analysis—offers the best balance.
People Also Ask
Is SPSS harder to learn than Excel?
Yes, SPSS typically requires learning a dedicated syntax language and statistical terminology, which increases initial complexity. Excel is often easier to pick up for basic tasks due to its familiar interface.
SPSS can be tougher at first because of syntax, while Excel is more approachable for beginners.
Can I perform advanced statistics in Excel?
Excel supports many statistical calculations through built-in functions and add-ins, but its breadth and depth are generally less extensive than SPSS for formal analyses. For advanced tests, SPSS is usually preferred.
Excel can do many stats with formulas, but SPSS is built for advanced tests.
How do I decide between SPSS and Excel for a project?
Evaluate the task type (exploratory vs. confirmatory), data size, need for reproducible workflows, and licensing. If you require rigorous statistics and audit trails, SPSS is often the better fit; for quick prep and visualization, Excel is typically optimal.
Think about the task and team capabilities to choose the right tool.
Is licensing a barrier to adoption?
Licensing can influence adoption, especially in smaller teams. Excel is commonly bundled with office suites, while SPSS requires a separate license or institutional access.
Licensing matters—Excel is usually easier to obtain, SPSS might require a formal license.
Can I use both tools in a workflow?
Absolutely. A practical workflow often uses Excel for data cleaning and initial exploration, then SPSS for formal analysis and reporting. This hybrid approach can maximize strengths while keeping costs reasonable.
Yes—combine Excel and SPSS to leverage each tool’s strengths.
The Essentials
- Choose SPSS for formal statistics and reproducibility
- Use Excel for data prep, quick analyses, and visuals
- Invest in syntax learning to improve long-term reproducibility
- Assess licensing and team skills before committing to a tool
- Consider a hybrid workflow to leverage strengths of both tools